
- Home >
- Stock Photos >
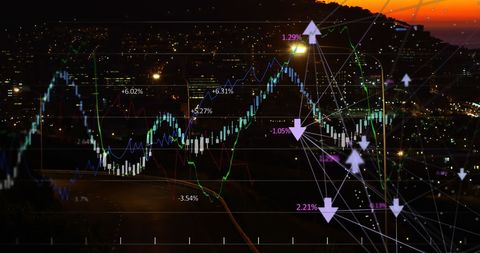
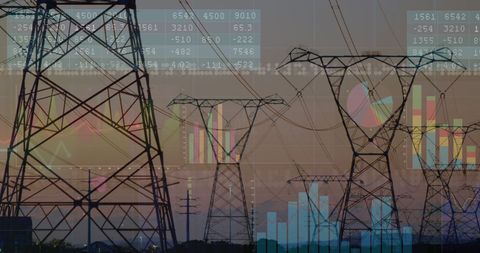
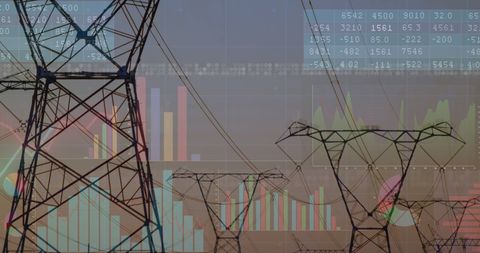
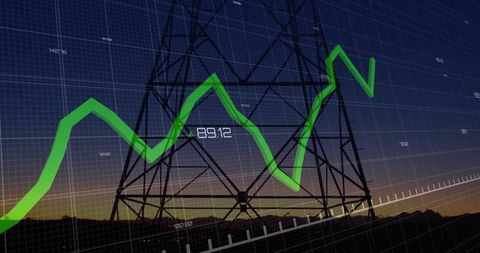
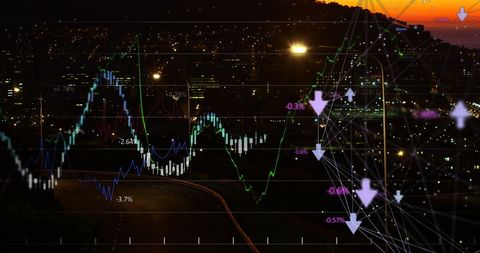
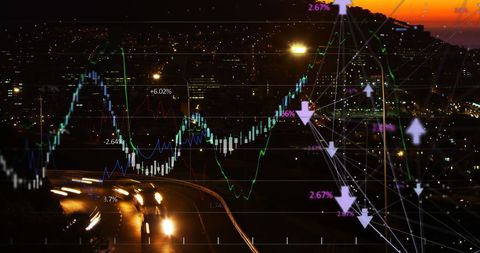
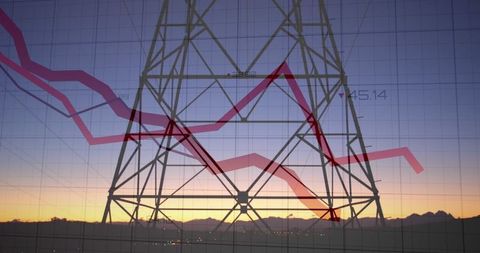
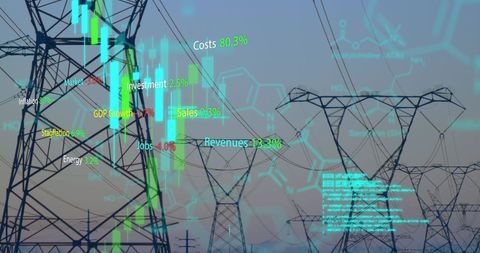
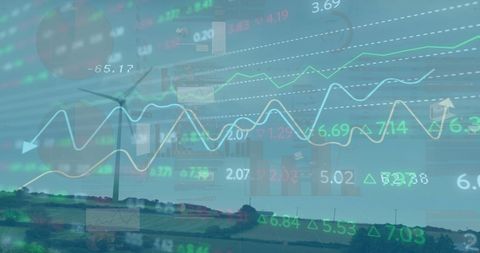
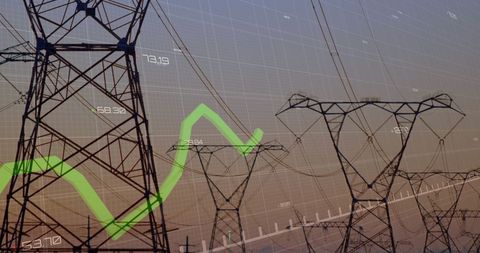
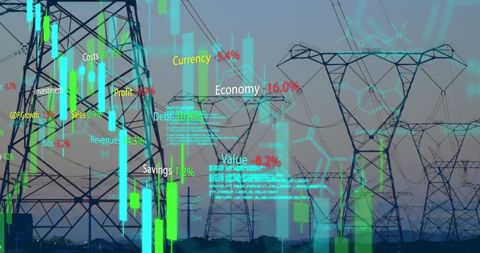
- Financial Data Visualization Overlaying Industrial Frame
Financial Data Visualization Overlaying Industrial Frame Image

Silhouette of an industrial structure combined with upward and downward financial graphs and numbers, representing complex data analysis. Use this digital graphic for financial reports, presentations on economics, or articles about investment trends and energy market dynamics.
Powered by 


downloads
Tags:
More
Credit Photo
If you would like to credit the Photo, here are some ways you can do so
Text Link
photo Link
<span class="text-link">
<span>
<a target="_blank" href=https://pikwizard.com/photo/financial-data-visualization-overlaying-industrial-frame/2bc02d5f4cbeb6cdf0384b3b7680bad8/>PikWizard</a>
</span>
</span>
<span class="image-link">
<span
style="margin: 0 0 20px 0; display: inline-block; vertical-align: middle; width: 100%;"
>
<a
target="_blank"
href="https://pikwizard.com/photo/financial-data-visualization-overlaying-industrial-frame/2bc02d5f4cbeb6cdf0384b3b7680bad8/"
style="text-decoration: none; font-size: 10px; margin: 0;"
>
<img src="https://pikwizard.com/pw/medium/2bc02d5f4cbeb6cdf0384b3b7680bad8.jpg" style="margin: 0; width: 100%;" alt="" />
<p style="font-size: 12px; margin: 0;">PikWizard</p>
</a>
</span>
</span>
Free (free of charge)
Free for personal and commercial use.
Author: Awesome Content
Similar Free Stock Images

Premium


Premium


Premium


Premium


Premium


Premium


Premium


Premium


Premium

Premium


Premium


Premium


Premium


Premium


Premium


Premium


Premium


Premium

Premium


Premium

Premium


Premium


Premium

Premium


Premium


Explore More Free Stock Images