1. Home > 
  2. Stock Photos > 
  3. Financial Data Visualization Overlaying Workspace

Financial Data Visualization Overlaying Workspace Image

Financial Data Visualization Overlaying Workspace

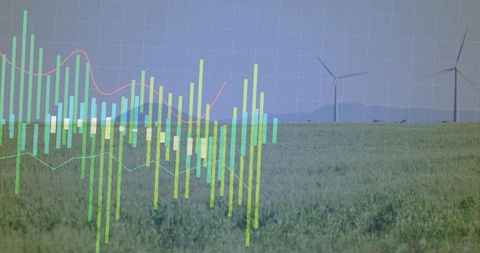
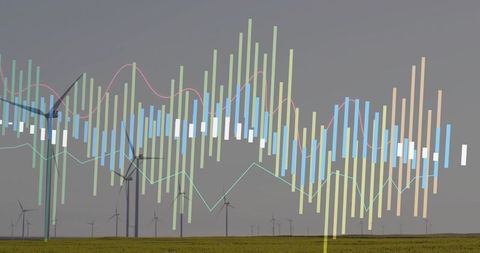
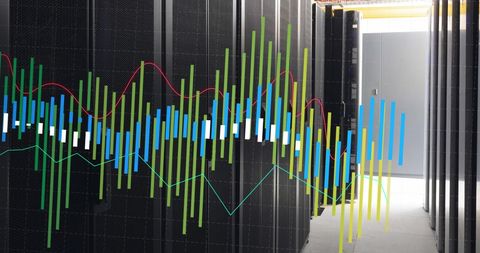
Graphic presents colorful financial data charts superimposed on an office environment with a computer and documents, symbolizing the integration of technology and financial analysis. Ideal for illustrating financial reporting, market analysis, or financial technology articles. Utilized for promoting financial services, showcasing finance management tools, or visualizing economic research.

Powered by Shutterstock logo - Get 15% off with code: PIKWIZARD15
Two diverse crypto traders brokers stock exchange market investors discussing trading charts research reports growth using pc computer looking at screen analyzing invest strategy, financial risks. - Powered by Shutterstock - Get 15% off with code: PIKWIZARD15Businessman analyzing forex trading graph financial data. Stock Market Investments Funds and Digital Assets. Business finance technology and investment concept. Business finance background. - Powered by Shutterstock - Get 15% off with code: PIKWIZARD15Businessman using tablet Analytics Data KPI Dashboard Tech with charts, metrics, and KPI to analyze performance and create insight reports for operations management.Data mining.Data analysis.Ai - Powered by Shutterstock - Get 15% off with code: PIKWIZARD15Business people analyze financial data chart trading forex, Investing in stock markets, funds and digital assets, Business finance technology and investment concept, Business finance background. - Powered by Shutterstock - Get 15% off with code: PIKWIZARD15Business team collaboration discussing working analyzing with financial data and marketing growth report graph in team, presentation and brainstorming to strategy planning making profit of company. - Powered by Shutterstock - Get 15% off with code: PIKWIZARD15

Credit Photo

If you would like to credit the Photo, here are some ways you can do so

Free (free of charge)

Free for personal and commercial use.

Author: Authentic Images

Similar Free Stock Images

Digital Financial Data and Market Trends Analysis on Black Background
Premium
Smart city and abstract polygon pattern connection with speed line light, big data connection technology concept .
Dynamic Digital Data Visualization Over Modern Cityscape
Abstract Data Graph Infographic on Purple Gradient Background
Digital Data Visualization in Abstract Design
Abstract Data Processing Visualization on Blue Gradient
Premium
Business finance data analytics graph chart report, man using laptop computer hand typing investment data digital marketing KPI sale report, financial management technology, cyber space metaverse.
Colorful Financial Data Visualization with Statistical Graphs
Businessman Analyzing Data with Overlaid Graphs in Office
Abstract Data Analysis and Digital Interface
Financial Data Analysis Visualization in Modern Office Environment
Premium
Male mature caucasian ceo businessman leader with diverse coworkers team, executive managers group at meeting. Multicultural professional businesspeople working together on research plan in boardroom.
Abstract Data Visualization with Bar and Line Graphs on Network Grid
Financial Data Analysis with Bar and Line Graph Elements
Digital Financial Data Visualization with Bar Graphs and Line Charts
Abstract Financial Charts with Colorful Holographic Effects
Premium
Analysis finance grow graph and market  investment. Financial  business plan,earnings,sale and strategy. Stock market chart, exchange financial growth diagram.
Dynamic Data Display with Bars and Lines on Grid Background
Financial Data Analytics Superimposed Over Computer Servers
Colorful Financial Graph with Digital Technology Concept
Colorful Financial Data Analytics and Digital Graph
Premium
Big data analytics with AI technology. Data analyst analyzing and visualizing complex information network with artificial intelligence. Machine learning algorithm for business analytics and finance.
Colorful Data Visualization with Technological Icon Elements
Global Data Processing with Abstract Graph and Network
Financial Data Analysis with Graphs and Charts on Dark Background
Financial Data Processing Over Armenian Flag Background
Premium
Mature older ceo businesswoman mentor in glasses negotiating growth business plan with diverse executive managers at boardroom meeting table using laptop. Multicultural team work together in office.
Real-Time Financial Market Trends Visualization with Candlestick and Histogram
Colorful Digital Waveform Display with Vertical Bars
Digital Candlestick Chart on Virtual Grid in Blue Tone
Cityscape with Data Visualization Overlay Exhibiting Urban Analytics
Financial Data Charts in Blue Digital Interface Background
Digital Data and Global Shipping Concept
Premium
Businessman using KPI dashboard.Financial business KPI System data analytics graph dashboard.Data System KPI and metrics connected in database for follow earnings,operations and sales data.
Dynamic Data Visualization on Digital Interface
Digital Data Graphs with Blue Background and Light Flare
Digital Data Analysis with Rising Arrows on Black Background
Ukrainian Flag with Financial Graphs Depicting Economic Crisis
Premium
Businessman using mobile smart phone. Business global internet connection application technology and digital marketing, Financial and banking, Digital link tech, big data.
Pink Graph and Data Analysis on 3D Grid for Financial Trends
Dynamic Financial Data Analysis on Digital Platform
Analyzing Financial Market Trends with Data Visualization
Dynamic Bars Overlapping Graph in Financial Analysis
Premium
Focused young freelance business man analyzing financial data on desktop large display, working on marketing chart, sales report, using modern Internet technology for job, typing on laptop
Colorful Financial Data Visualization on Digital Grid
Financial Data Analytics Over Equatorial Guinea Flag
Data Analytics Overlaid on Modern Office Workspace
Colorful Data Analytics Bar Graphs on Digital Screen
Premium
Businessman using laptop computer analyzing sales data and financial growth graph chart report. Business planning, strategy and development. Financial accounting. market research, data analysis
Digital Data Visualization on Office Desk Background
Dynamic Financial Data Chart on Blue Background
Statistical Analysis in Server Room Highlighting Technology Data
Digital Financial Data Overlay on Modern Office Environment
Premium
Business woman using mobile smart phone and online working on laptop computer, surfing the internet, searching the information at office. Female student online studying from home, e-learning
Binary Code with Colorful Bar Graph for Data Analysis
Data Visualization with Diagrams on Green Gradient
Financial Growth Graph on Digital Office Glass
Dynamic Data Visualization with Binary Matrix
Premium
Internet cyberspace data information collection analytical statistics computer storage ai artificial intelligence calculation, blue background banner copyspace.
Futuristic Data Visualization Over Wind Farm Landscape
Colorful Soundwave Over Urban Skyline Abstraction
Displaying multi-series bar chart with smooth trend lines and metric callouts on dark navy backgroun
Abstract Financial Data Background with Dynamic Charts
Digital Financial Data Over Urban Night Skyline
Abstract Digital Data Flow on Modern Building Facade
Premium
Digital technology, global business network connection, data analysis, social media marketing, digital software development, teamwork and business strategy, internet technology concept
Digital Graph with Abstract Data on Blue Background
Abstract Data Visualization with Growing Charts
Financial Candlestick Chart on Digital Grid Background
Dynamic Financial Data Analysis with Interactive Charts and Graphs
Premium
Abstract glowing big data forex candlestick chart on blurry city backdrop. Trade, technology, investment and analysis concept. Double exposure
Digital Financial Graph in Modern Office Setting
Financial Data Overlays in Modern Office Workspace
Financial Data Visualization with Line and Bar Graphs
Futuristic Data Analysis with Bar Graphs and Charts Overlay
Premium
Economy and growth on global business network, Business strategy and Digital marketing. Data analysis of financial and banking, Technology protection and data connection
Financial Data Graph Overlay in Modern Office Environment
Business Analytics Concept with Data Graphs and Office Desk
Data Visualization Overlay in Dark Computer Server
Colorful Graphical Data Analysis in Abstract Background
Premium
Close-up photo of male hands with laptop. Man working remotely at home. Concept of networking or remote work. Global business network.
Digital Financial Data Analysis with Vibrant Graphs
Multi-Colored Charts Superimposed Over Urban Skyline
Abstract Financial Data Charts Reflecting Economic Trends
Colorful Digital Data Processing Network Connections
Premium
businessman holding Global network connection. Big data analytics and business intelligence concept. World map point and line composition concept of global business.Digital link tech.
Dynamic Financial Data Chart on Green Gradient Background
Digital Stock Market Data with Upward Trend Graph
Futuristic Financial Charts Over Night Urban Skyline
Bar Chart with Line Graph on Automotive Technology Background
Premium
Target marketing plan investor financial analysis chart strategic growth concept, Women people use laptop analyze growth information, Human resource plan, financial data, Long term business plan
Dynamic HTML Code and Waveform Bar Interface for Cybersecurity
Neon Financial Data Visualization with Multicolored Candlestick Bars and Trend Lines
Financial Charts with Upward Trend and Analysis Tools
Cityscape with Dynamic Financial Data Virtual Visualization
Colorful Bar Charts and Arrows on Vivid Red Background
Abstract Colorful Bar Graph on Red Background
Premium
African American woman analyzing financial data on laptop screen in hybrid office setting for digital entrepreneurship KPI dashboard.
Colorful Data Streams in Digital Interface
Abstract Financial Data Analysis Conceptual Design
Digital Finance Chart Displayed in Modern Office
Abstract Cityscape with Blue and Pink Data Graphs Overlay
Premium
Finance analyst working on business analytics and data management system to make financial report with business performance, KPI dashboard. Corporate strategy for finance, digital marketing plan
Financial Data Overlay on Busy Construction Site
Financial Data Processing with Digital Interface Graphics
Dynamic Financial Data Charts Histogram
Abstract Multicolored Graphs Overlay on Office Desk Setting
Premium
Analyst working with Financial Report and Business Analytics Dashboard on laptop computer to analyze Financial Data with KPI and Metrics. Investment, Operations, Sales, Corporate Finance, Strategy.
Digital Financial Data Analytics Overlay in Modern Office
Financial Data Analysis with Chinese Flag Over Harbor
Abstract Graphic Business Data Visualization
Digital Data Chart Visualization in Modern Office Environment
Premium
Smiling mature businessman holding smartphone sitting in office. Middle aged manager ceo using cell phone mobile apps and laptop. Digital technology applications and solutions for business development
Financial Data Representation in Modern Office Context
Dynamic Financing Data Visualization on Hungary Flag
Financial Data Processing in Digital Interface Concept
Digital Financial Graphs and Data Analysis Visualization
Premium
Businesswoman working with business data, finance, marketing report, Big Data Analytics technology, Processing Complexity information flow on virtual screen, machine learning, artificial intelligence.
Digital Data Analysis Over World Map with Graphs and Codes
Digital Analytics Dashboard with Code and Graphs Visualization
Dynamic Financial Market Chart Display with Candlesticks
Businesswoman Analyzing Financial Data on Tablet with Transparent Charts
Premium
Financial advisor explaining invest stock market data consulting investor. Two busy business men analysts doing finance trading analysis pointing at exchange chart on laptop screen working in office.
Walking Colleagues in Glass Atrium with Neon Magenta Bar Chart and Cyan Data Grid Overlay