- Home >
- Stock Photos >
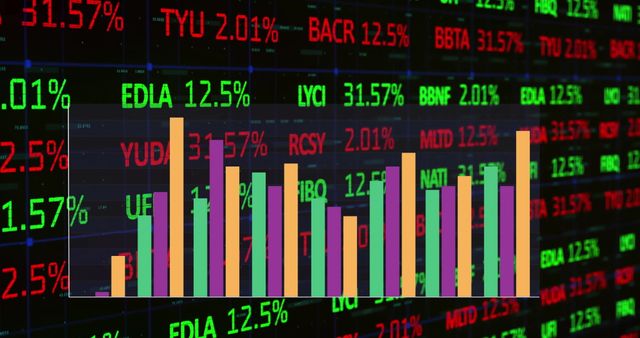
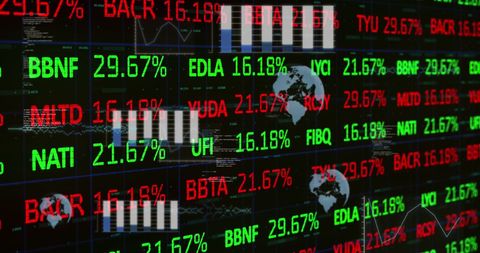
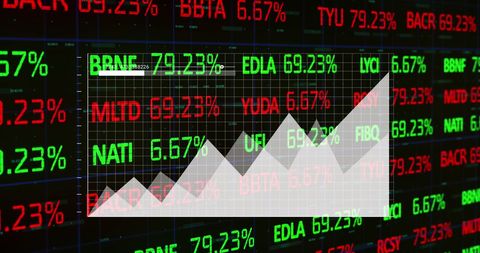
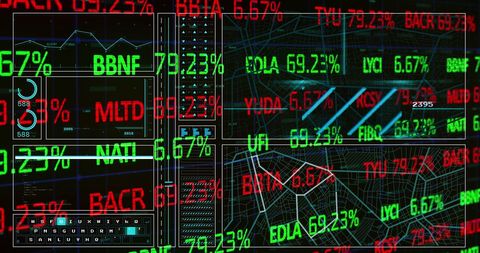
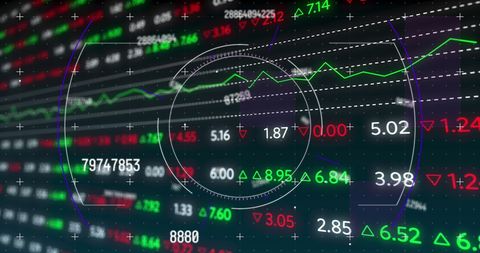
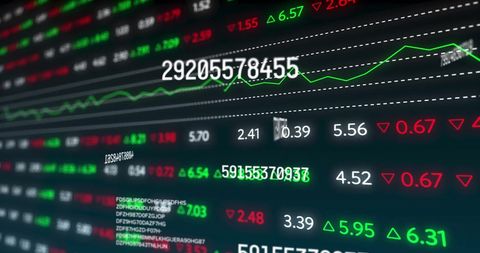
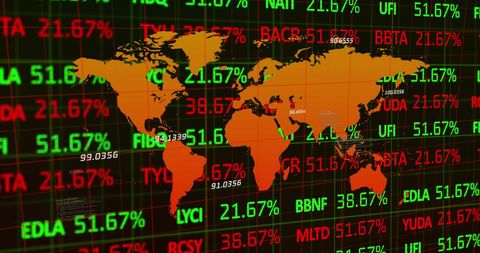
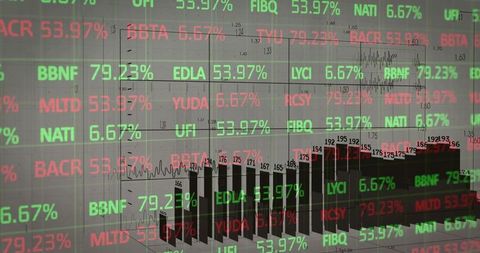
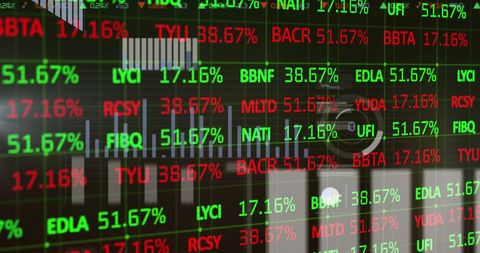
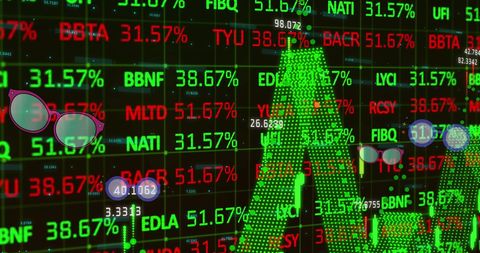
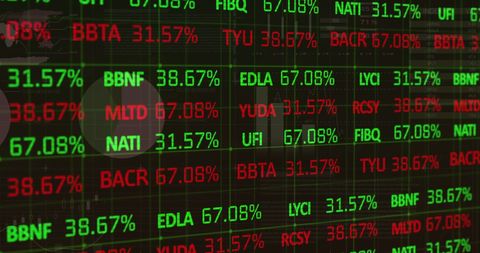
- Financial Data Visualization with Analytics Interface
Financial Data Visualization with Analytics Interface Image

Complex digital interface displaying financial market statistics with various analytical tools. Commonly used in business offices dealing with investment or stock trading, illustrating technological advancements in data processing. Ideal for websites, blogs, or content on finance, analytics, and data-driven business strategies.

downloads
Tags:
More
Credit Photo
If you would like to credit the Photo, here are some ways you can do so
Text Link
photo Link
<span class="text-link">
<span>
<a target="_blank" href=https://pikwizard.com/photo/financial-data-visualization-with-analytics-interface/0e8c1976f36541790bb026041aef9999/>PikWizard</a>
</span>
</span>
<span class="image-link">
<span
style="margin: 0 0 20px 0; display: inline-block; vertical-align: middle; width: 100%;"
>
<a
target="_blank"
href="https://pikwizard.com/photo/financial-data-visualization-with-analytics-interface/0e8c1976f36541790bb026041aef9999/"
style="text-decoration: none; font-size: 10px; margin: 0;"
>
<img src="https://pikwizard.com/pw/medium/0e8c1976f36541790bb026041aef9999.jpg" style="margin: 0; width: 100%;" alt="" />
<p style="font-size: 12px; margin: 0;">PikWizard</p>
</a>
</span>
</span>
Free (free of charge)
Free for personal and commercial use.
Author: Creative Art