
- Home >
- Stock Photos >
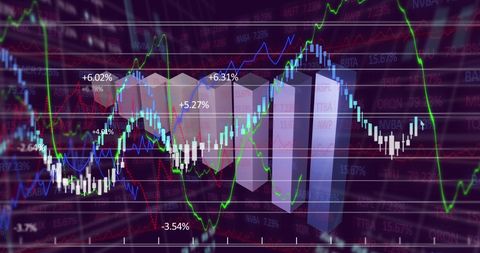
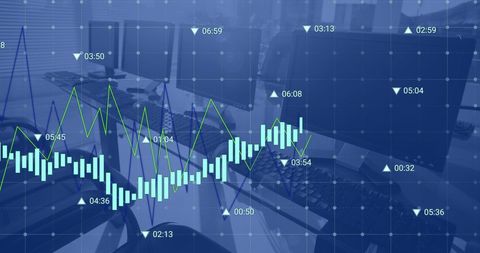
- Financial Data Visualization with Bar Charts and Graphs
Financial Data Visualization with Bar Charts and Graphs Image

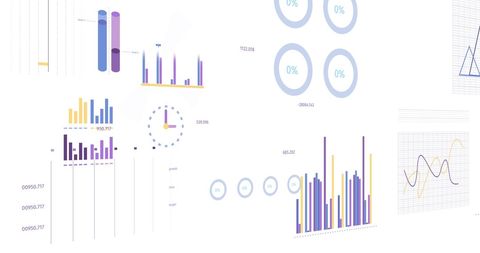
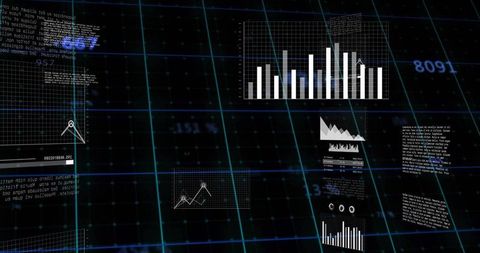
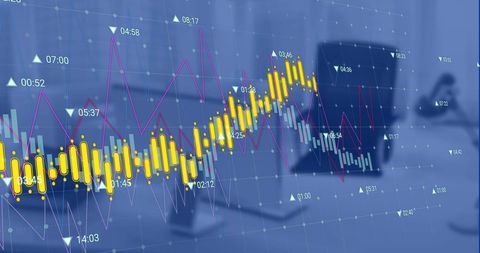
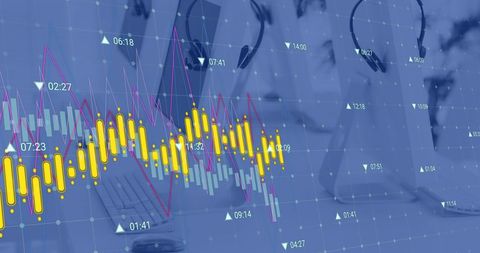
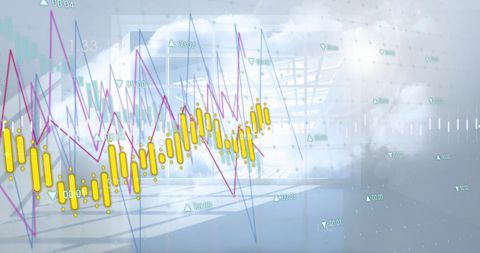
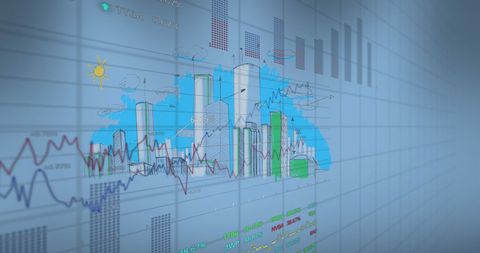
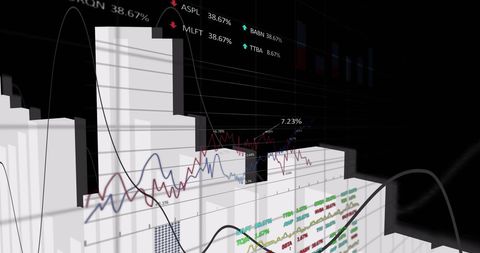
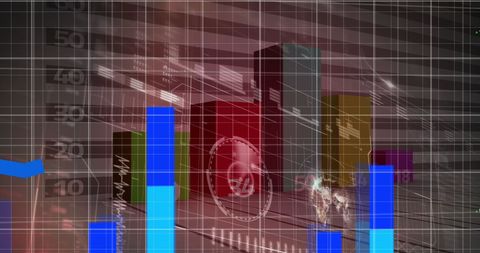
The visual represents financial data analysis with a focus on economics, including inflation and stagflation rates. The bar charts and graphs depict complex statistical information. It can be used in presentations, articles on economic trends, or educational materials on data analysis.
Powered by 


downloads
Tags:
More
Credit Photo
If you would like to credit the Photo, here are some ways you can do so
Text Link
photo Link
<span class="text-link">
<span>
<a target="_blank" href=https://pikwizard.com/photo/financial-data-visualization-with-bar-charts-and-graphs/6cb2be7b33b0c560a5afefacaf3cda2a/>PikWizard</a>
</span>
</span>
<span class="image-link">
<span
style="margin: 0 0 20px 0; display: inline-block; vertical-align: middle; width: 100%;"
>
<a
target="_blank"
href="https://pikwizard.com/photo/financial-data-visualization-with-bar-charts-and-graphs/6cb2be7b33b0c560a5afefacaf3cda2a/"
style="text-decoration: none; font-size: 10px; margin: 0;"
>
<img src="https://pikwizard.com/pw/medium/6cb2be7b33b0c560a5afefacaf3cda2a.jpg" style="margin: 0; width: 100%;" alt="" />
<p style="font-size: 12px; margin: 0;">PikWizard</p>
</a>
</span>
</span>
Free (free of charge)
Free for personal and commercial use.
Author: Awesome Content
Similar Free Stock Images

Premium


Premium

Premium


Premium


Premium


Premium


Premium


Premium


Premium


Premium


Premium


Premium

Premium

Premium


Premium


Premium


Premium

Premium


Premium


Premium

Premium


Premium


Premium
Premium


Premium


Explore More Free Stock Images