- Home >
- Stock Photos >
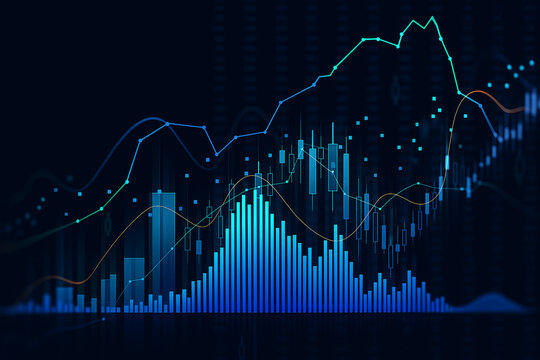
- Financial Data Visualization with Bar Charts in Urban Skyline
Financial Data Visualization with Bar Charts in Urban Skyline Image

Double exposure of urban skyline with financial charts shows integration of modern technology and finance. Helpful for illustrating concepts in fintech, data analysis presentations, and articles on urban financial strategies or trends.
Powered by 


2
downloads
downloads
Tags:
More
Credit Photo
If you would like to credit the Photo, here are some ways you can do so
Text Link
photo Link
<span class="text-link">
<span>
<a target="_blank" href=https://pikwizard.com/photo/financial-data-visualization-with-bar-charts-in-urban-skyline/ca8401dd8932dfa9baa5e916bd5db555/>PikWizard</a>
</span>
</span>
<span class="image-link">
<span
style="margin: 0 0 20px 0; display: inline-block; vertical-align: middle; width: 100%;"
>
<a
target="_blank"
href="https://pikwizard.com/photo/financial-data-visualization-with-bar-charts-in-urban-skyline/ca8401dd8932dfa9baa5e916bd5db555/"
style="text-decoration: none; font-size: 10px; margin: 0;"
>
<img src="https://pikwizard.com/pw/medium/ca8401dd8932dfa9baa5e916bd5db555.jpg" style="margin: 0; width: 100%;" alt="" />
<p style="font-size: 12px; margin: 0;">PikWizard</p>
</a>
</span>
</span>
Free (free of charge)
Free for personal and commercial use.
Author: Creative Art
Similar Free Stock Images

Premium


Premium


Premium


Premium


Premium


Premium


Premium


Premium


Premium


Premium


Premium


Premium


Premium


Premium


Premium


Premium


Premium


Premium


Premium


Premium


Premium


Premium


Premium


Premium