- Home >
- Stock Photos >
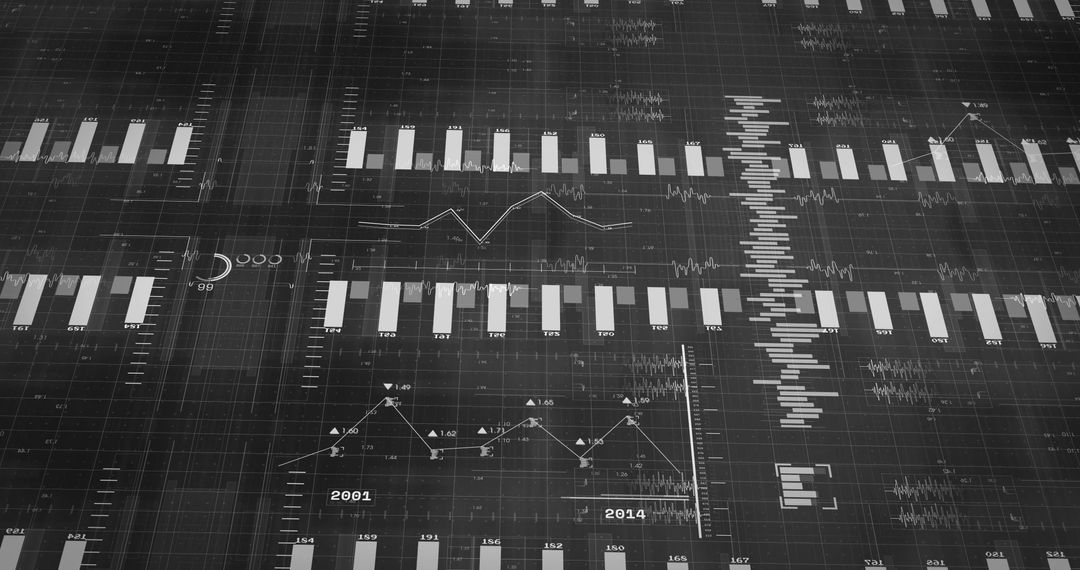
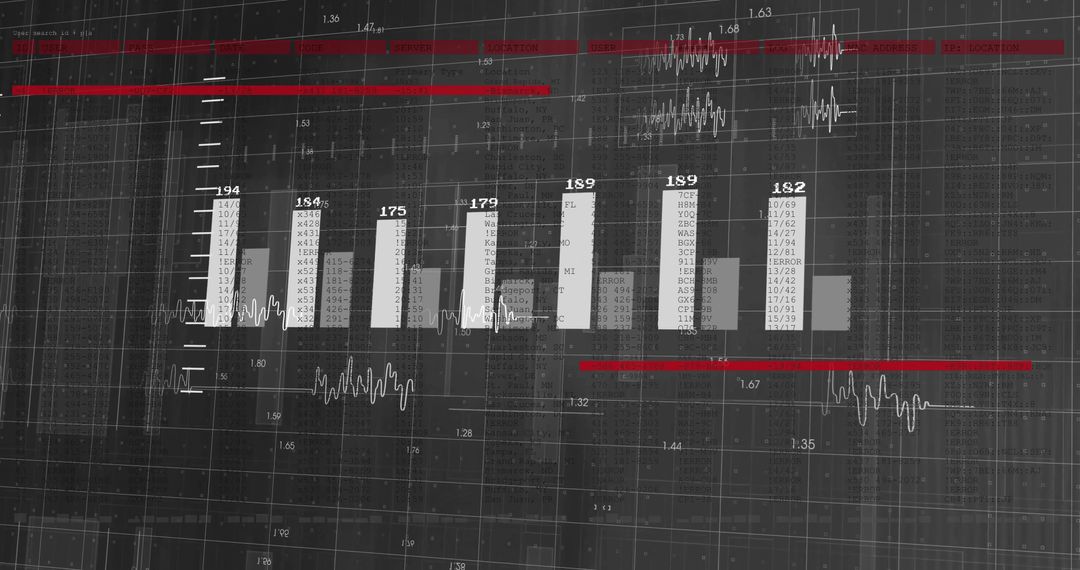
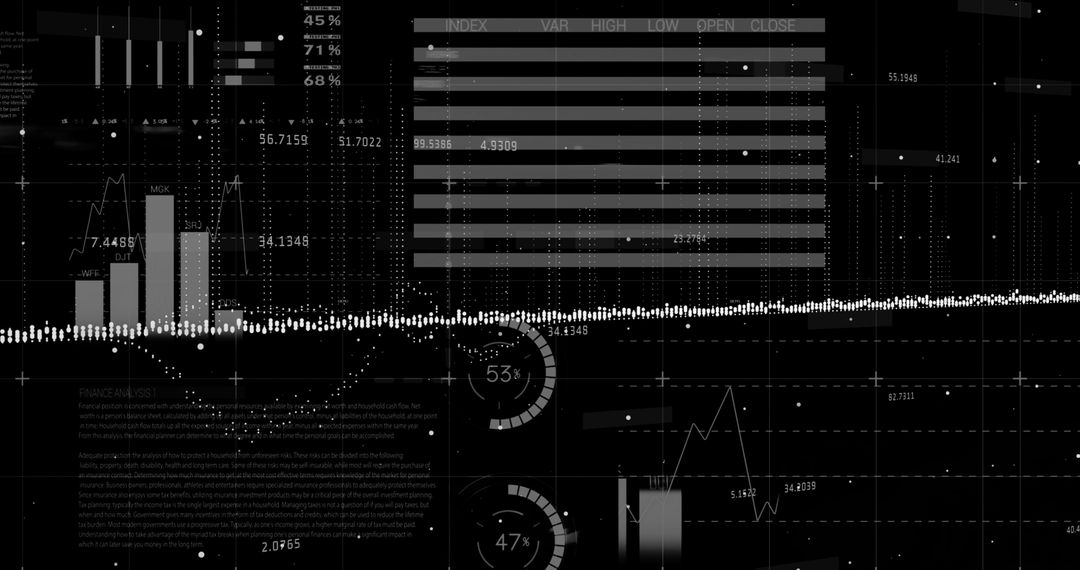
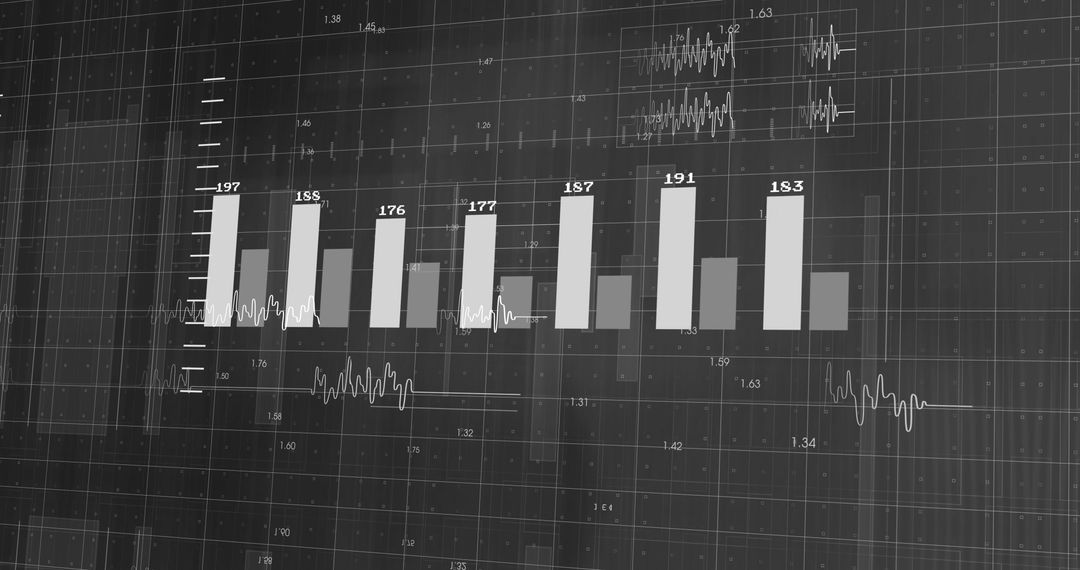
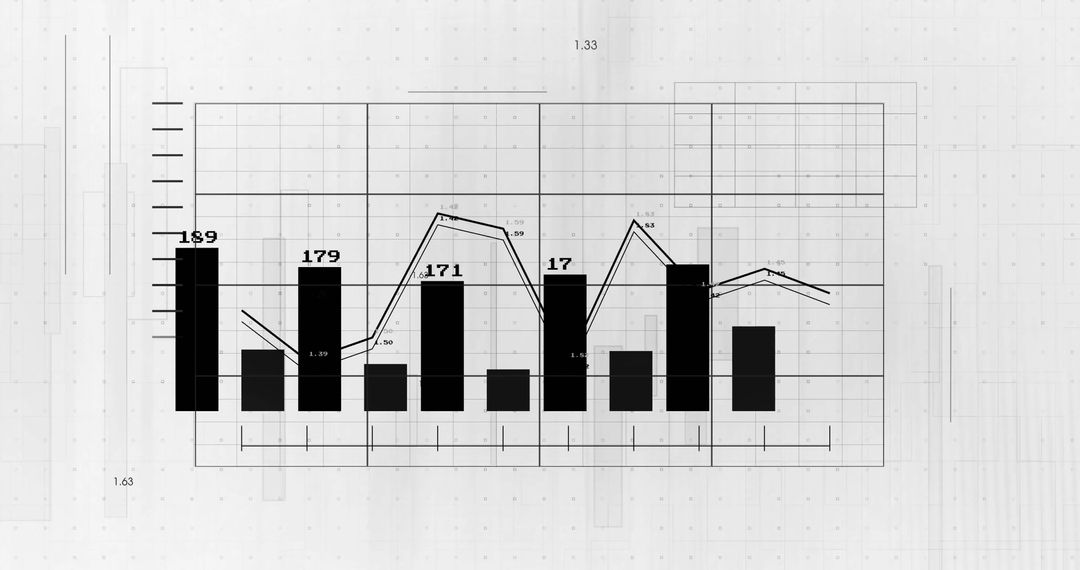
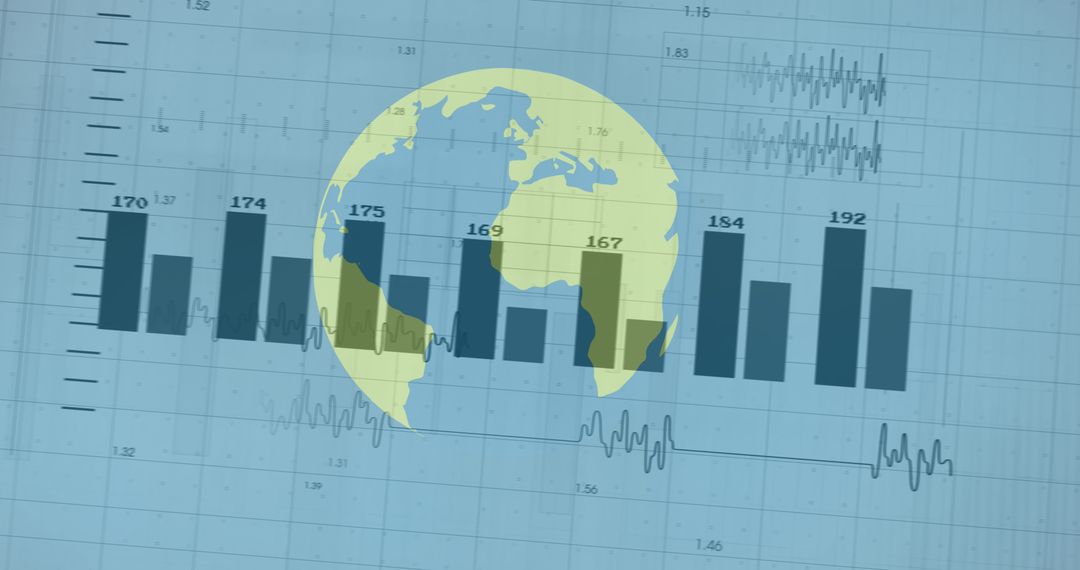
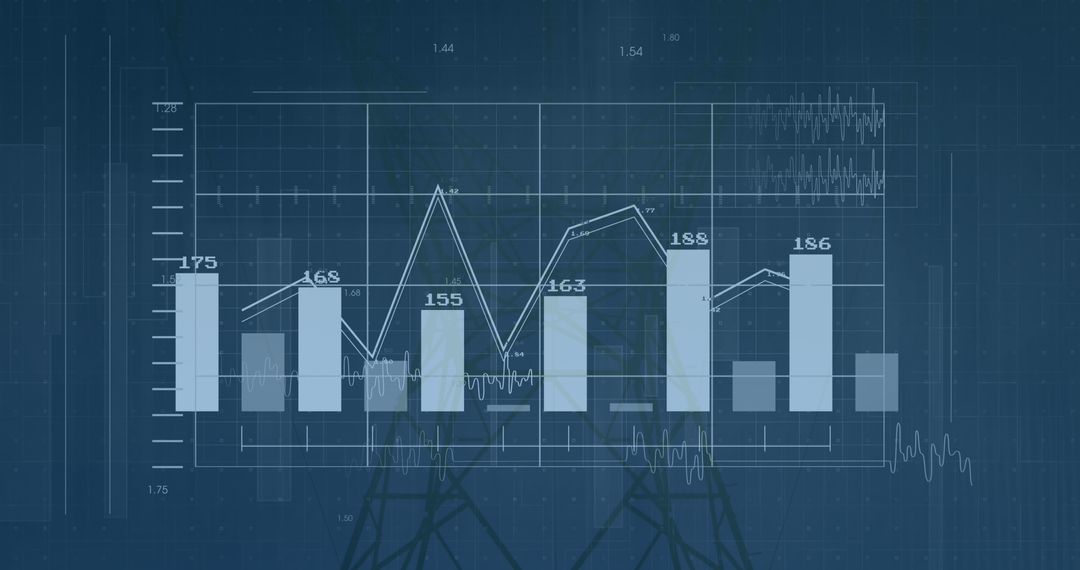
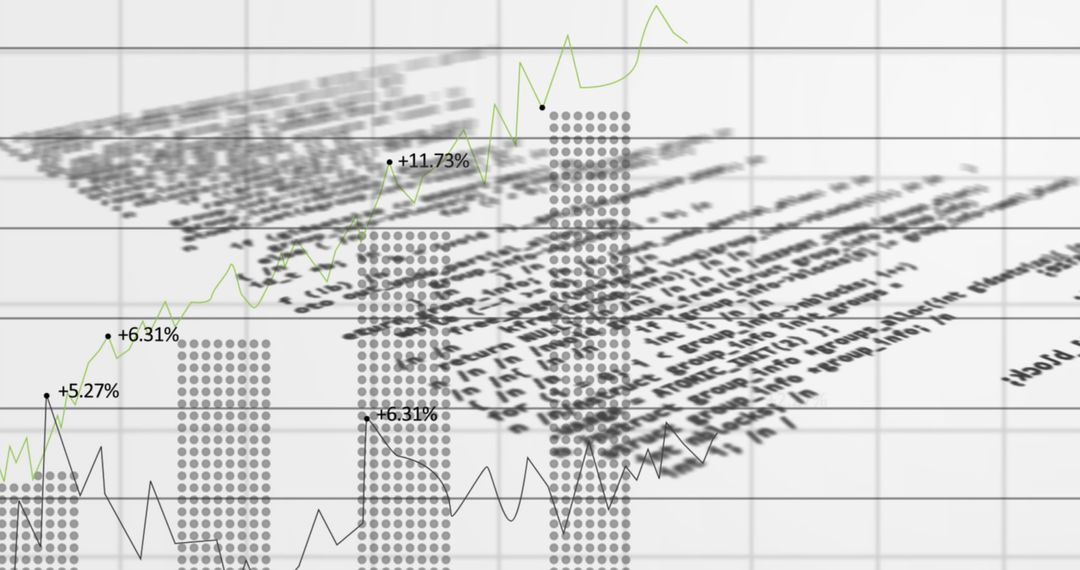
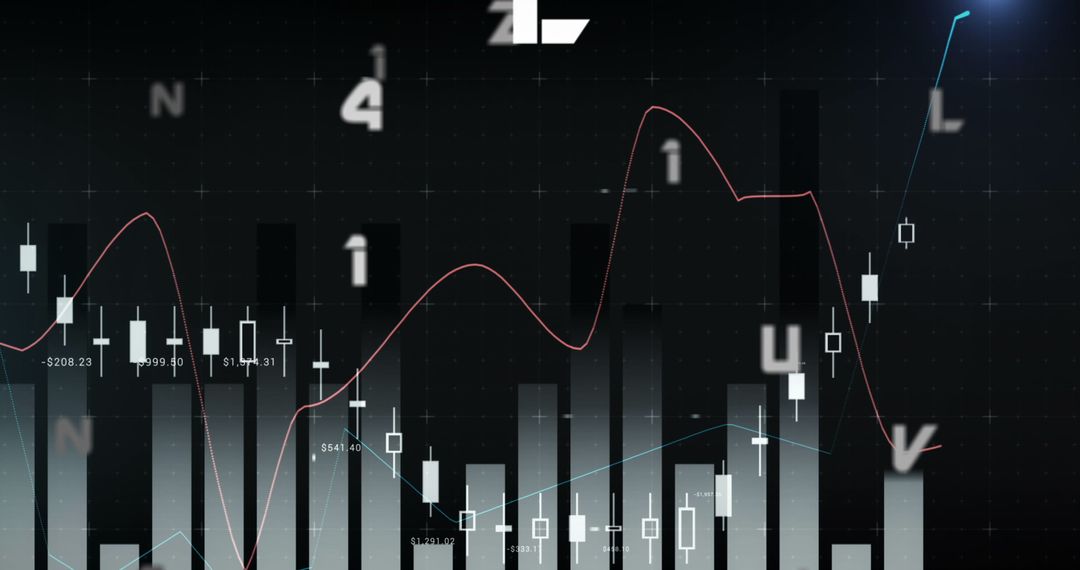
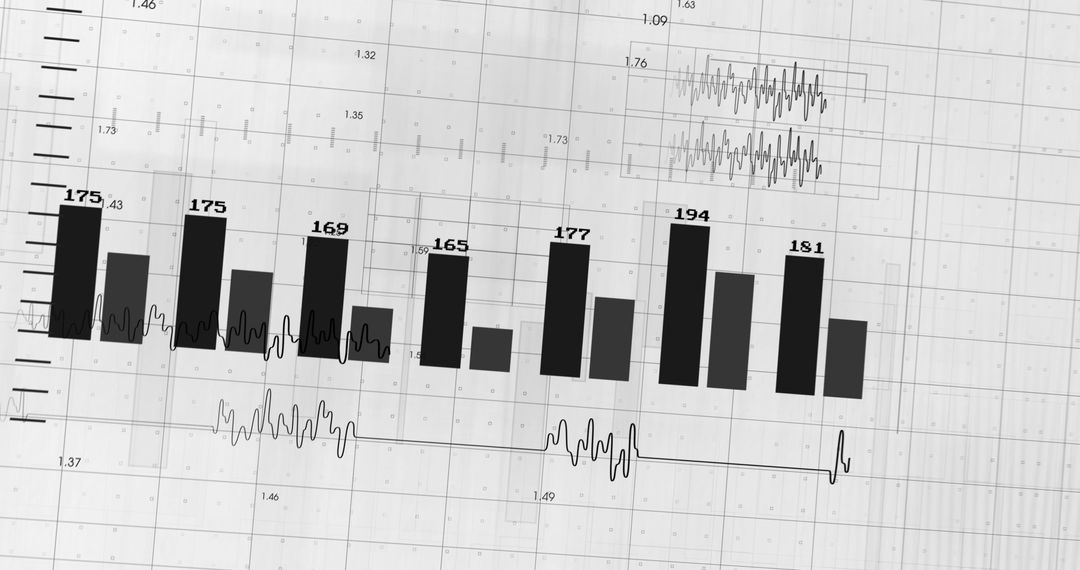
- Financial Data Visualization with Bar Charts Overlaid on Digital Grid
Financial Data Visualization with Bar Charts Overlaid on Digital Grid Image
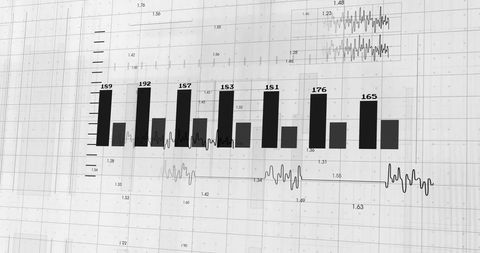
This visual shows dynamic financial data represented through bar charts set on a digital grid, symbolizing data processing and analysis in business. Ideal for presentations, tech workshops, and articles on global finance topics.
Powered by  - Get 15% off with code: PIKWIZARD15


0
downloads
downloads
Tags:
More
Credit Photo
If you would like to credit the Photo, here are some ways you can do so
Text Link
photo Link
<span class="text-link">
<span>
<a target="_blank" href=https://pikwizard.com/photo/financial-data-visualization-with-bar-charts-overlaid-on-digital-grid/9051bf531a1269606b5bf8c5c84c4d6c/>PikWizard</a>
</span>
</span>
<span class="image-link">
<span
style="margin: 0 0 20px 0; display: inline-block; vertical-align: middle; width: 100%;"
>
<a
target="_blank"
href="https://pikwizard.com/photo/financial-data-visualization-with-bar-charts-overlaid-on-digital-grid/9051bf531a1269606b5bf8c5c84c4d6c/"
style="text-decoration: none; font-size: 10px; margin: 0;"
>
<img src="https://pikwizard.com/pw/medium/9051bf531a1269606b5bf8c5c84c4d6c.jpg" style="margin: 0; width: 100%;" alt="" />
<p style="font-size: 12px; margin: 0;">PikWizard</p>
</a>
</span>
</span>
Free (free of charge)
Free for personal and commercial use.
Author: People Creations
Similar Free Stock Images

Premium


Premium


Premium


Premium


Premium


Premium


Premium


Premium


Premium


Premium


Premium


Premium


Premium


Premium


Premium


Premium


Premium


Premium


Premium


Premium


Premium


Premium


Premium


Premium