
- Home >
- Stock Photos >
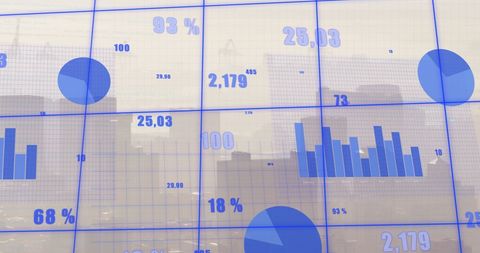
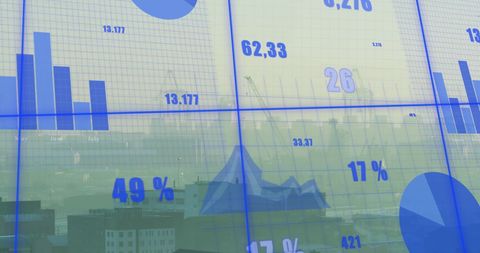
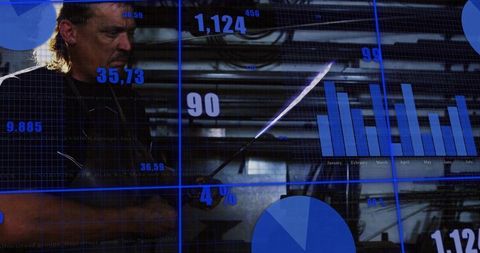
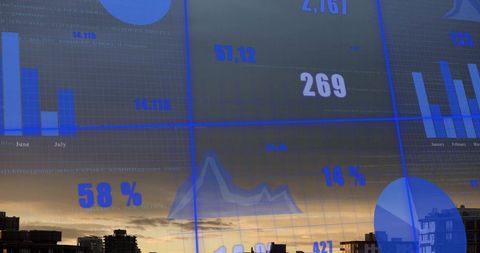
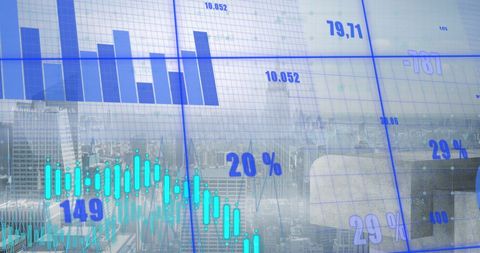
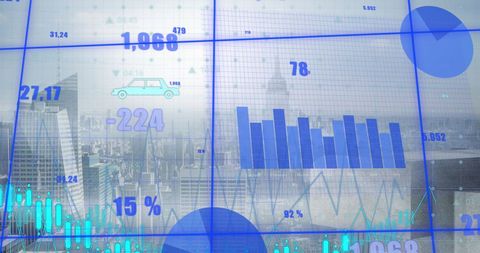
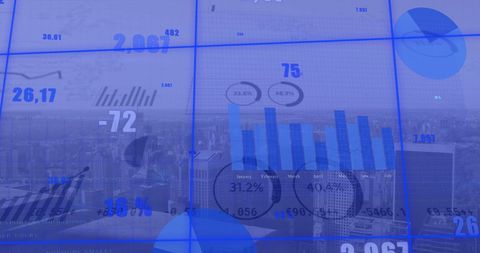
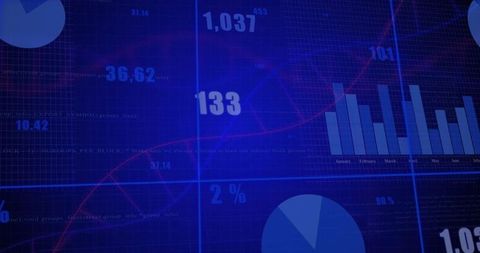
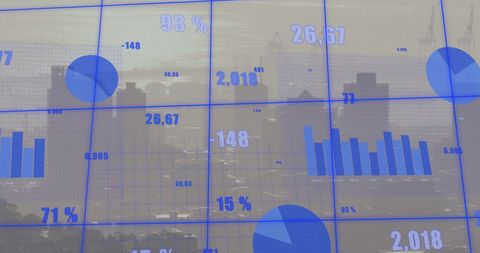
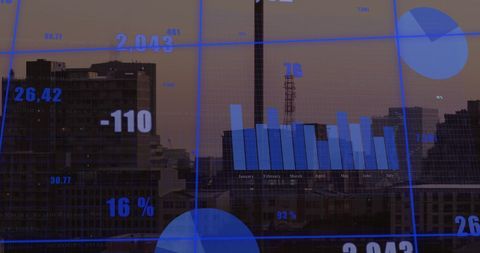
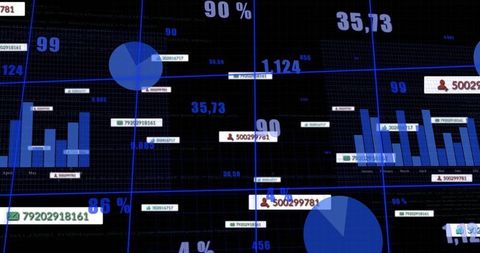
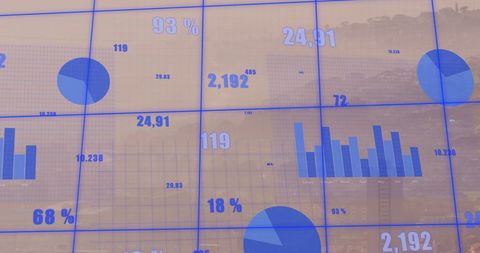
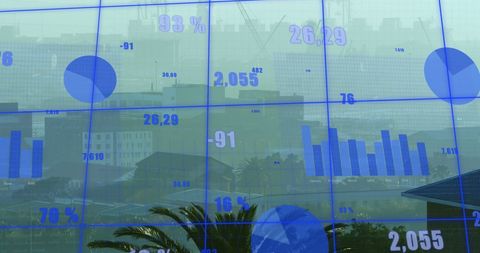
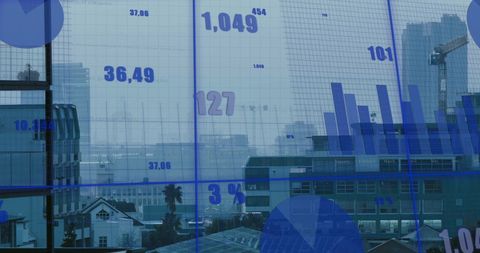
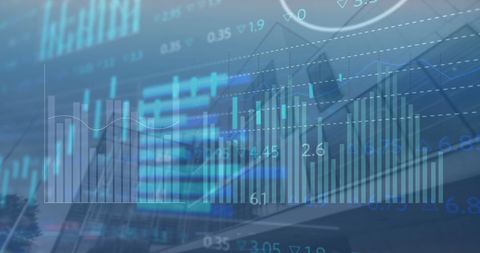
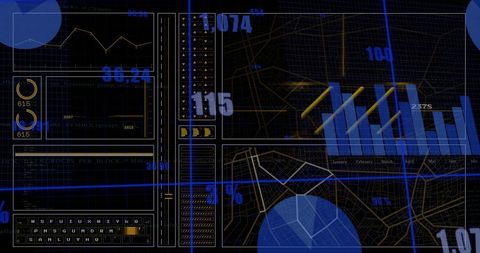
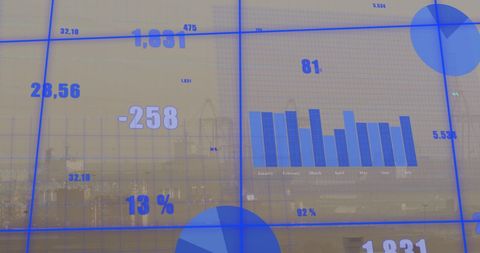
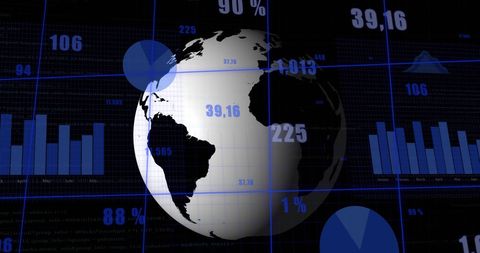
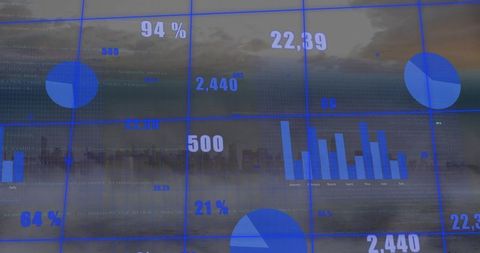
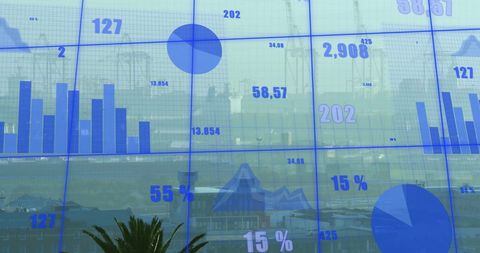
- Financial Data Visualization with Bars and Pie Charts
Financial Data Visualization with Bars and Pie Charts Image

Image shows a visual representation of financial data with bar and pie charts, indicating analytical trends or statistics. Suitable for use in presentations, reports, financial news articles, or educational materials related to analytics, business trends, investments, and financial records.
Powered by 


downloads
Tags:
More
Credit Photo
If you would like to credit the Photo, here are some ways you can do so
Text Link
photo Link
<span class="text-link">
<span>
<a target="_blank" href=https://pikwizard.com/photo/financial-data-visualization-with-bars-and-pie-charts/aa92cf01db163bfee36cfe4fcdac719e/>PikWizard</a>
</span>
</span>
<span class="image-link">
<span
style="margin: 0 0 20px 0; display: inline-block; vertical-align: middle; width: 100%;"
>
<a
target="_blank"
href="https://pikwizard.com/photo/financial-data-visualization-with-bars-and-pie-charts/aa92cf01db163bfee36cfe4fcdac719e/"
style="text-decoration: none; font-size: 10px; margin: 0;"
>
<img src="https://pikwizard.com/pw/medium/aa92cf01db163bfee36cfe4fcdac719e.jpg" style="margin: 0; width: 100%;" alt="" />
<p style="font-size: 12px; margin: 0;">PikWizard</p>
</a>
</span>
</span>
Free (free of charge)
Free for personal and commercial use.
Author: Authentic Images
Similar Free Stock Images

Premium

Premium


Premium


Premium


Premium


Premium


Premium

Premium


Premium

Premium


Premium


Premium


Premium


Premium

Premium


Premium


Premium


Premium


Premium

Premium

Premium

Premium


Premium

Premium


Premium


Explore More Free Stock Images