
- Home >
- Stock Photos >
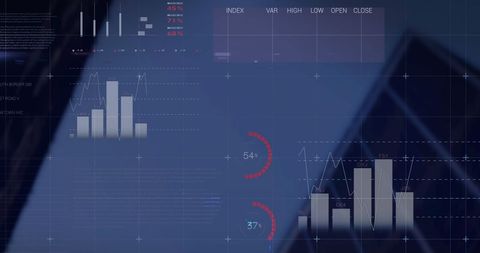
- Financial Data Visualization with Blurred Stock Ticker
Financial Data Visualization with Blurred Stock Ticker Image

Displays two bar charts representing statistical analysis and financial growth, overlaid on a subdued stock market ticker. Ideal for illustrating financial reports, blog articles on market trends, or presentations for investors.
Powered by  - Get 15% off with code: PIKWIZARD15


downloads
Tags:
More
Credit Photo
If you would like to credit the Photo, here are some ways you can do so
Text Link
photo Link
<span class="text-link">
<span>
<a target="_blank" href=https://pikwizard.com/photo/financial-data-visualization-with-blurred-stock-ticker/ab8a469be95a9240338df240b98804da/>PikWizard</a>
</span>
</span>
<span class="image-link">
<span
style="margin: 0 0 20px 0; display: inline-block; vertical-align: middle; width: 100%;"
>
<a
target="_blank"
href="https://pikwizard.com/photo/financial-data-visualization-with-blurred-stock-ticker/ab8a469be95a9240338df240b98804da/"
style="text-decoration: none; font-size: 10px; margin: 0;"
>
<img src="https://pikwizard.com/pw/medium/ab8a469be95a9240338df240b98804da.jpg" style="margin: 0; width: 100%;" alt="" />
<p style="font-size: 12px; margin: 0;">PikWizard</p>
</a>
</span>
</span>
Free (free of charge)
Free for personal and commercial use.
Author: Awesome Content
Similar Free Stock Images

Premium


Premium

Premium


Premium


Premium

Premium

Premium


Premium


Premium

Premium


Premium

Premium

Premium


Premium

Premium


Premium


Premium


Premium


Premium

Premium


Premium


Premium


Premium


Premium

Premium

Explore More Free Stock Images