- Home >
- Stock Photos >
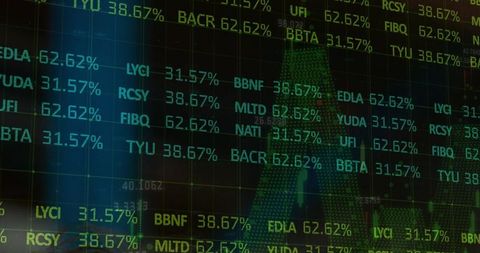
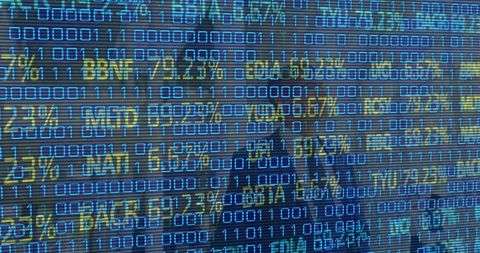
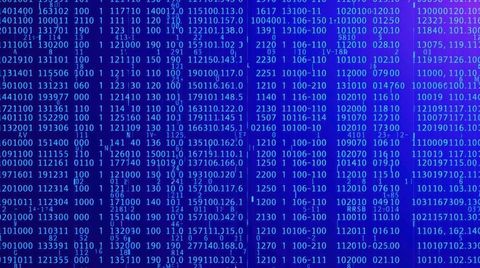
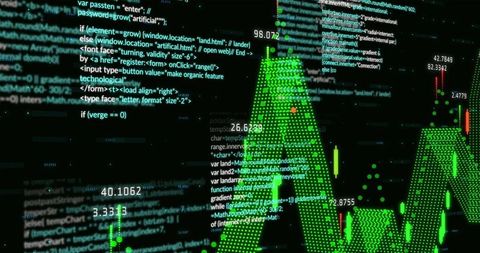
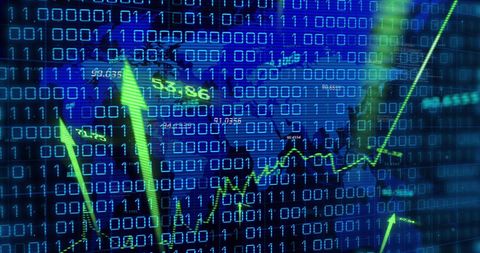
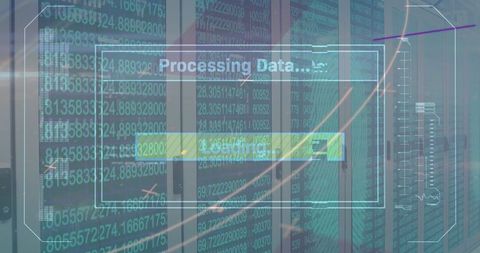
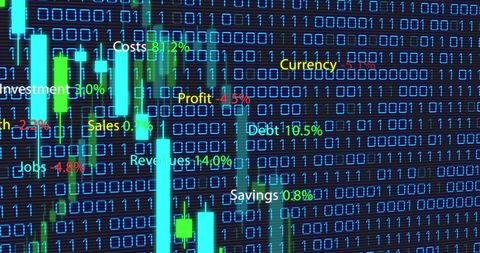
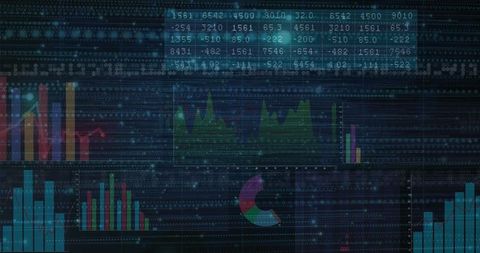
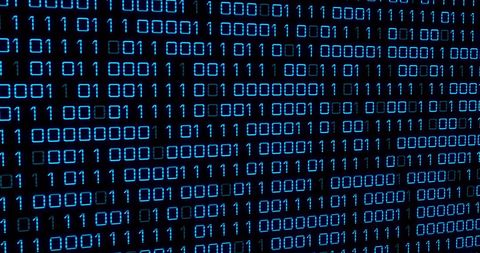
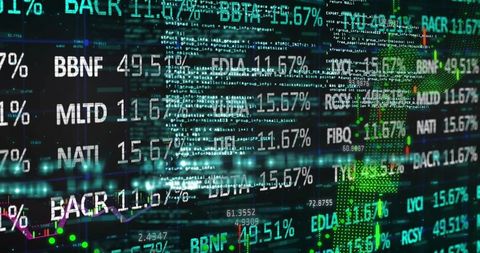
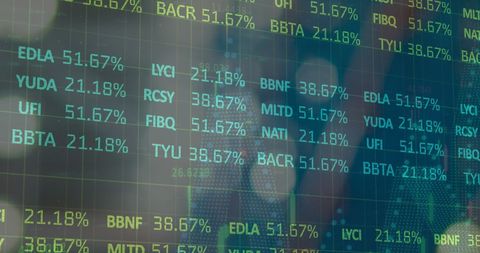
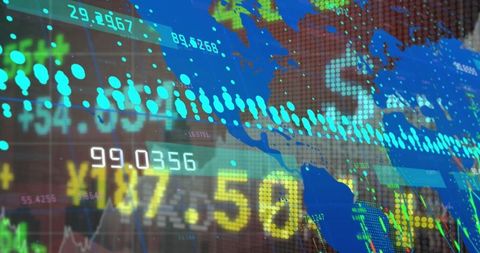
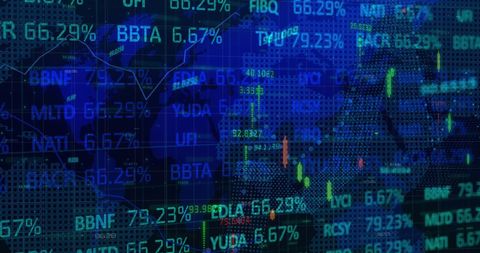
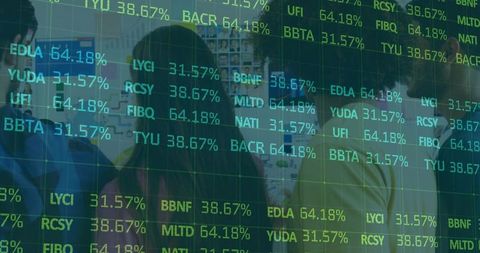
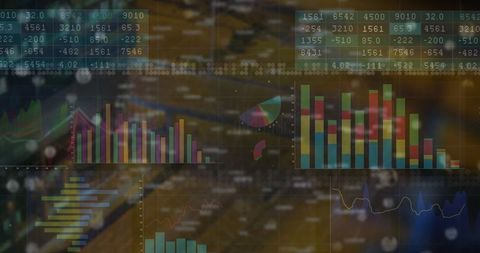
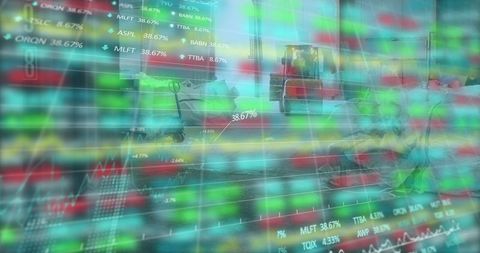
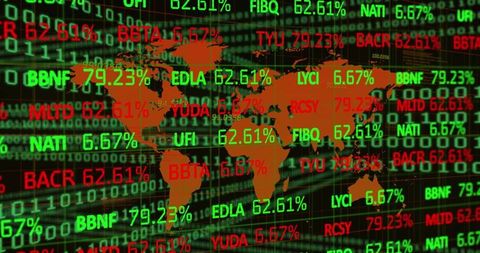
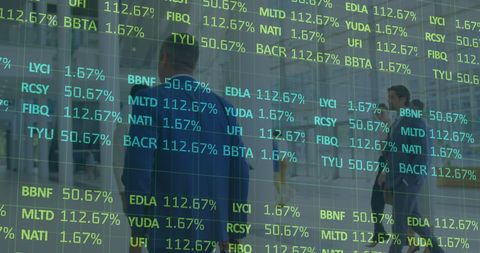
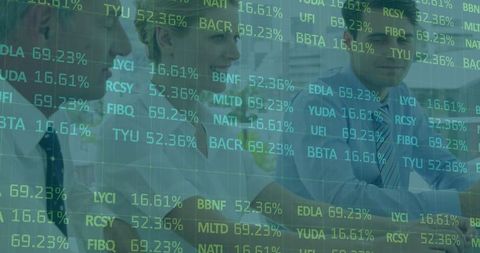
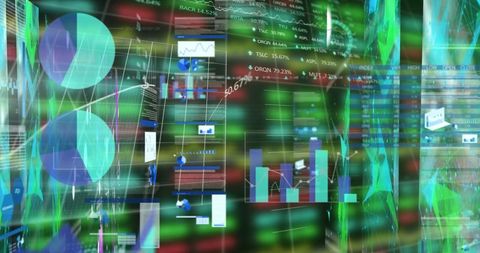
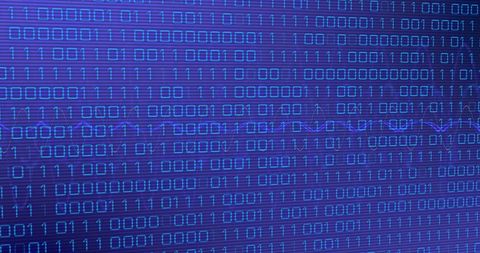
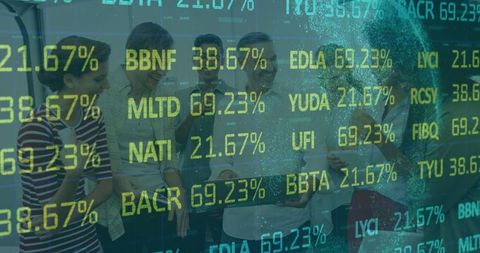
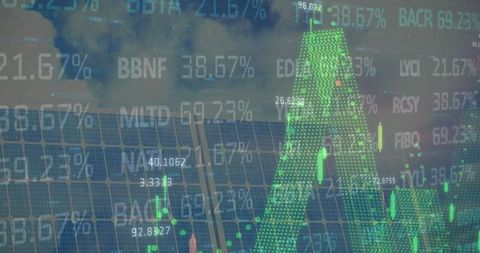
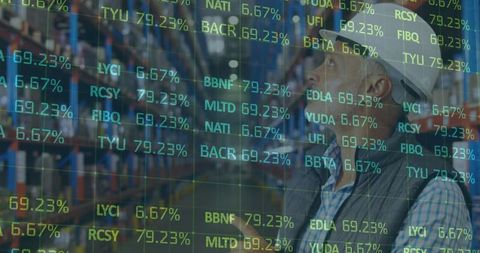
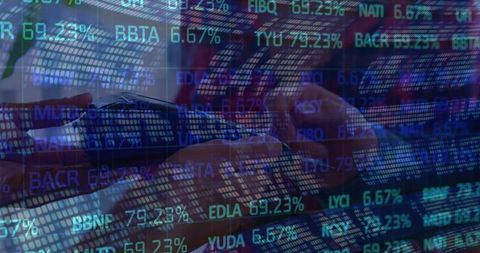
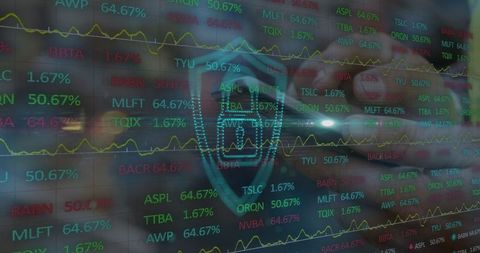
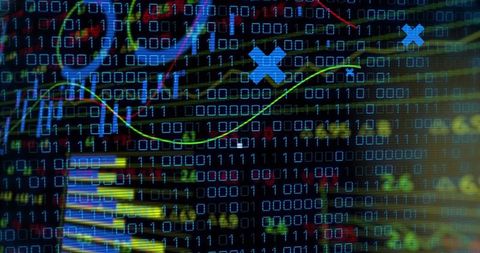
- Financial Data Visualization with Candlestick Chart and Binary Code
Financial Data Visualization with Candlestick Chart and Binary Code Image
Candlestick and binary code with colored percentages illustrate financial analysis. Useful for presentations related to finance, data analytics, market trends, digital trading tools, and economic reports.

downloads
Tags:
More
Credit Photo
If you would like to credit the Photo, here are some ways you can do so
Text Link
photo Link
<span class="text-link">
<span>
<a target="_blank" href=https://pikwizard.com/photo/financial-data-visualization-with-candlestick-chart-and-binary-code/af0f23e0bab0fdc412bcd61884ae132a/>PikWizard</a>
</span>
</span>
<span class="image-link">
<span
style="margin: 0 0 20px 0; display: inline-block; vertical-align: middle; width: 100%;"
>
<a
target="_blank"
href="https://pikwizard.com/photo/financial-data-visualization-with-candlestick-chart-and-binary-code/af0f23e0bab0fdc412bcd61884ae132a/"
style="text-decoration: none; font-size: 10px; margin: 0;"
>
<img src="https://pikwizard.com/pw/medium/af0f23e0bab0fdc412bcd61884ae132a.jpg" style="margin: 0; width: 100%;" alt="" />
<p style="font-size: 12px; margin: 0;">PikWizard</p>
</a>
</span>
</span>
Free (free of charge)
Free for personal and commercial use.
Author: People Creations