- Home >
- Stock Photos >
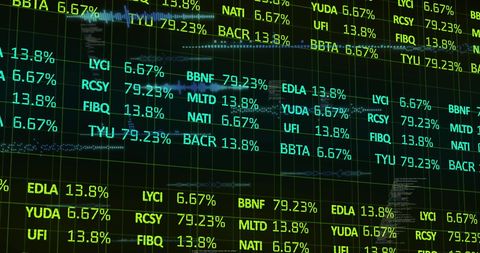
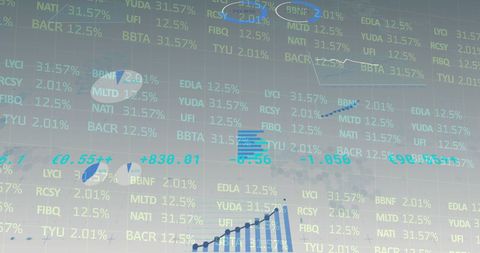
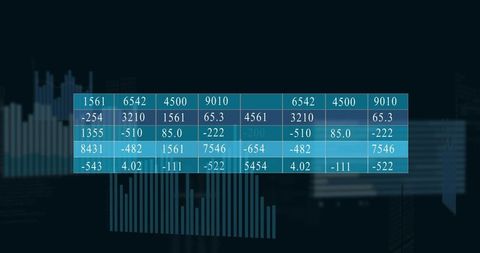
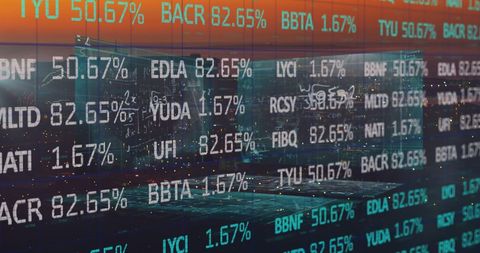
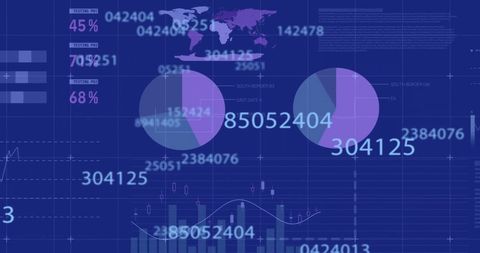
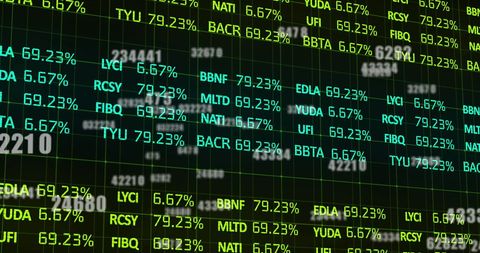
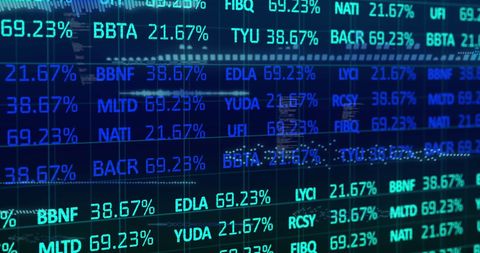
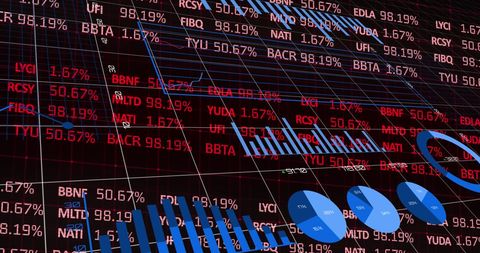
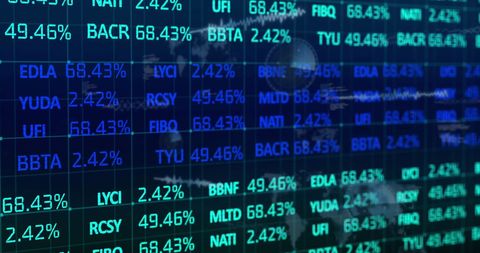
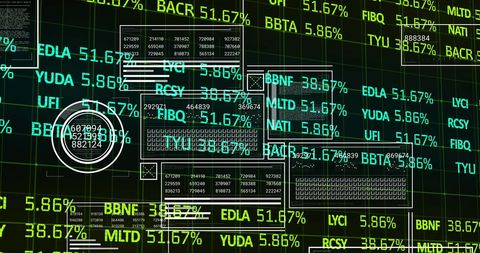
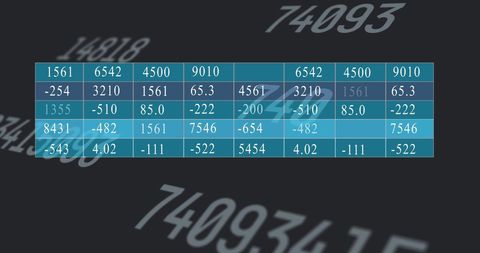
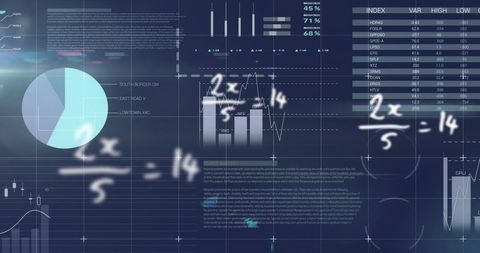
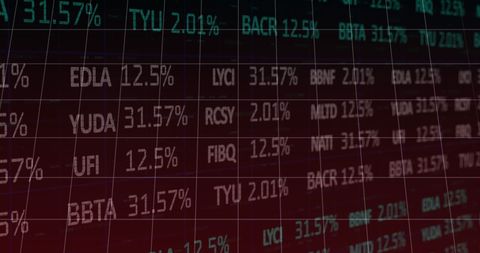
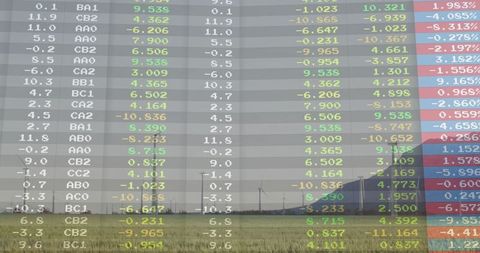
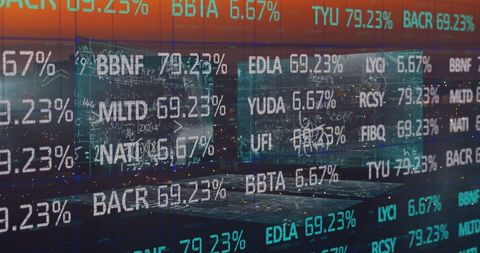
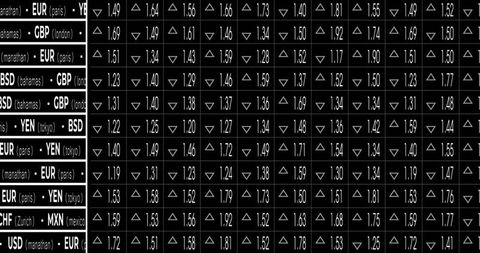
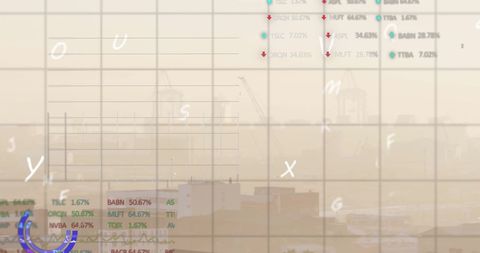
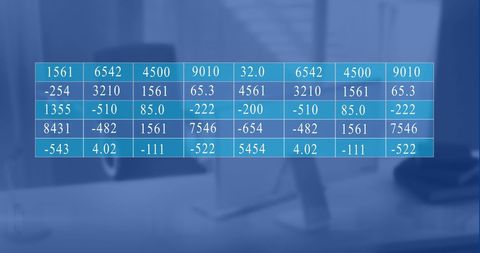
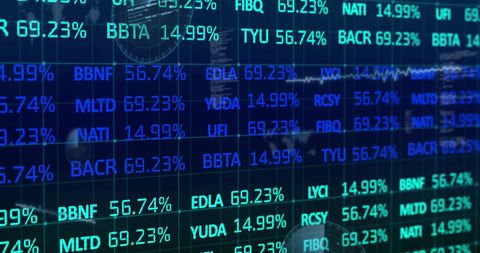
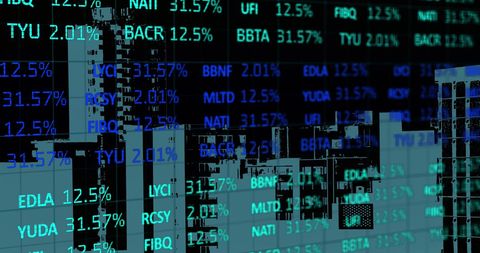
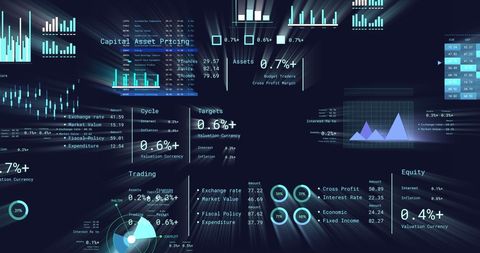
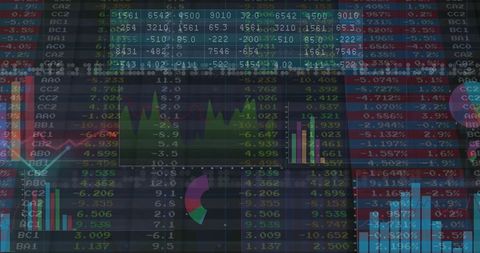
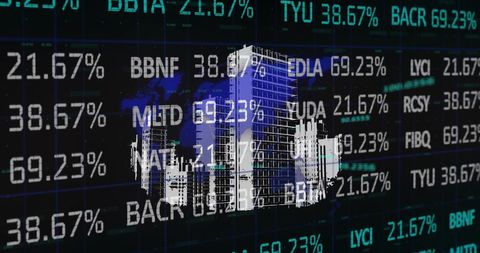
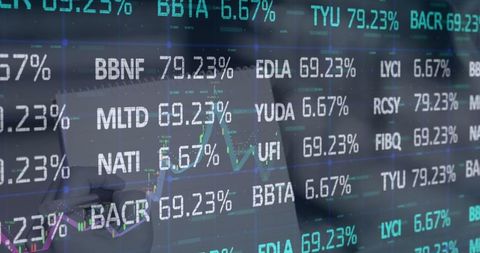
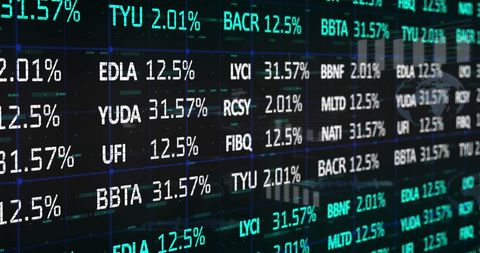
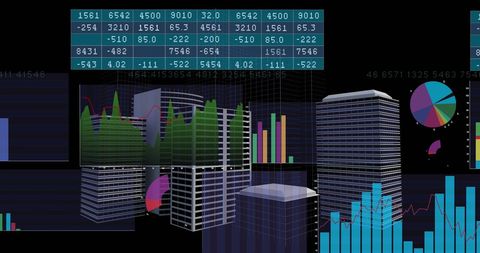
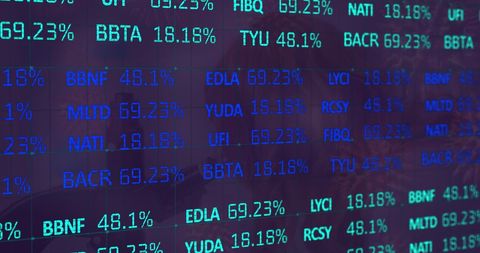
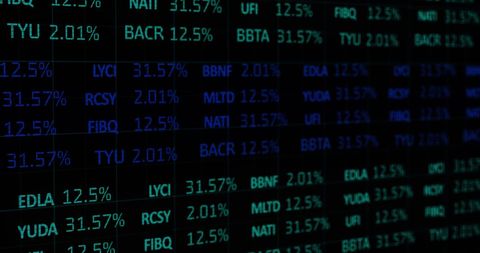
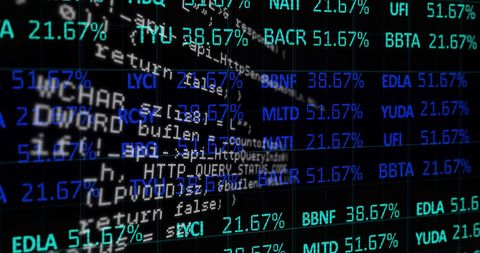
- Financial Data Visualization with Charts and Numbers
Financial Data Visualization with Charts and Numbers Image
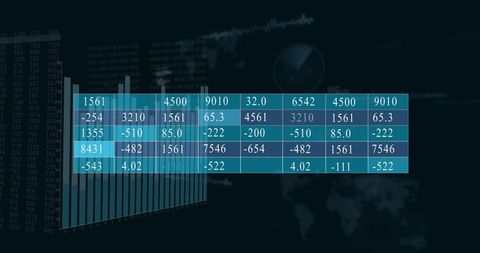
Visualizing complex financial data, with charts and numerical figures, suitable for presentations about global finance and business strategy. Great for emphasizing data analysis, economic trends, and leverage in investment reports.

downloads
Tags:
More
Credit Photo
If you would like to credit the Photo, here are some ways you can do so
Text Link
photo Link
<span class="text-link">
<span>
<a target="_blank" href=https://pikwizard.com/photo/financial-data-visualization-with-charts-and-numbers/b89e4f928ce88489af9dc6645a24edaf/>PikWizard</a>
</span>
</span>
<span class="image-link">
<span
style="margin: 0 0 20px 0; display: inline-block; vertical-align: middle; width: 100%;"
>
<a
target="_blank"
href="https://pikwizard.com/photo/financial-data-visualization-with-charts-and-numbers/b89e4f928ce88489af9dc6645a24edaf/"
style="text-decoration: none; font-size: 10px; margin: 0;"
>
<img src="https://pikwizard.com/pw/medium/b89e4f928ce88489af9dc6645a24edaf.jpg" style="margin: 0; width: 100%;" alt="" />
<p style="font-size: 12px; margin: 0;">PikWizard</p>
</a>
</span>
</span>
Free (free of charge)
Free for personal and commercial use.
Author: People Creations