1. Home > 
  2. Stock Photos > 
  3. Financial Data Visualization with Chemical Structures Background

Financial Data Visualization with Chemical Structures Background Image

Financial Data Visualization with Chemical Structures Background

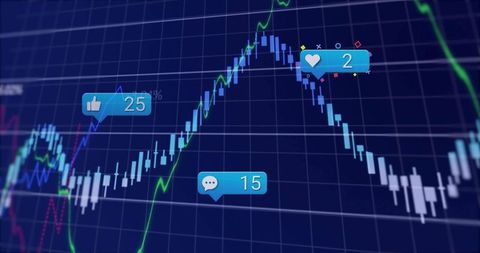
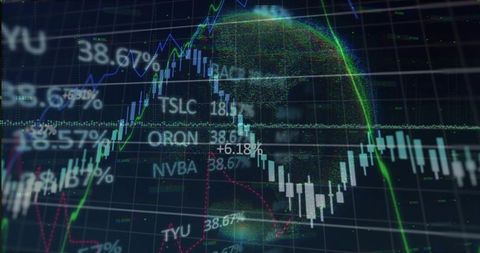
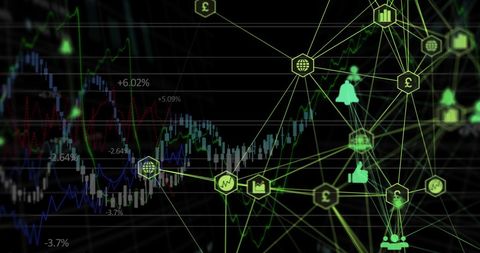
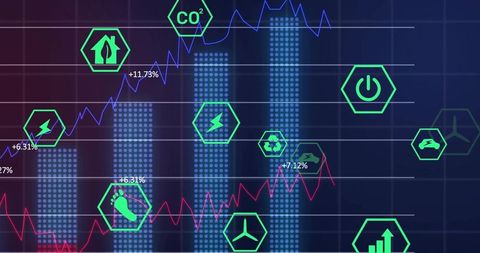
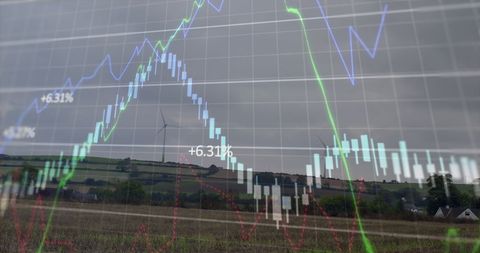
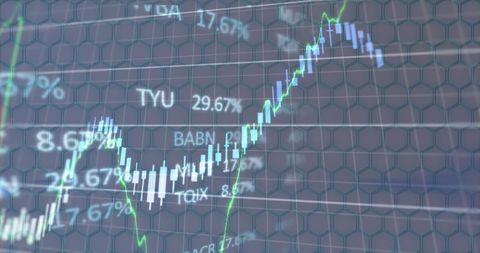
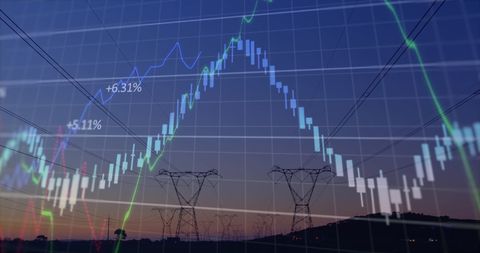
This image blends financial data processing with chemical structures, creating a unique visual effect that represents innovative business concepts, merging science and finance. Useful for articles on economic forecasts, business presentations, financial analysis reports, or educational material addressing interdisciplinary approaches.

Powered by Adobe logo
A person's outstretched hand displays a holographic interface with financial charts and molecular structures. - Powered by AdobePerson analyzing financial charts on computer monitors in a dimly lit room with colorful data displays - Powered by AdobeA businessman uses advanced technology to analyze financial growth trends, illustrated by modern graphs and data visualizations in a corporate setting. Impute - Powered by AdobeBusinessman interacting with digital forex and stock market chart interface showing buy and sell decisions with futuristic holographic data overlay. - Powered by AdobeClose-up view of dynamic financial market data displayed on a digital screen, showing candlestick charts and trend lines for investment analysis and trading decisions. - Powered by Adobe

Credit Photo

If you would like to credit the Photo, here are some ways you can do so

Free (free of charge)

Free for personal and commercial use.

Author: Creative Art

Similar Free Stock Images

Dynamic Financial Data Analytics and Stock Market Trends
Premium
ceo making data driven decisions using interactive pie charts and financial bar graphs display
Dynamic Global Financial Analytics with Rising Graph Visualization
Premium
Close-up of a digital display showing various charts and graphs in blue and orange hues, representing data analysis and business intelligence, ideal for technology or financial concepts
Premium
Modern digital dashboard with financial analytics, charts and performance metrics on technology interface
Global Financial Market Trends on Digital Screen
Premium
Awesome photo of man analyzing financial data on large digital dashboard with multiple charts and graphs.
Financial Graphs and Digital Data on Dark Background
Financial Data Graphs and Technology Interface Background
Digital Financial Data with Trending Arrows
Global Financial Data and Chemical Structure Integration
Premium
Laptop screen displaying financial charts
Premium
Trader working with charts on computer
Abstract Financial Graphs with Rising Trends and Positive Indicators
Premium
Financial Data Analysis Charts and Graphs.
FinTech Global Data Chart with Statistical Analysis
Digital Connectivity Network on Global Graph Background
Financial Data Information with Graphs and Charts for Stock Market Analysis
Digital Trading Screen with Interactive Social Engagement Elements
Premium
A vibrant blue bar chart displays increasing financial data overlaid with a glowing yellow line graph showing a positive upward trend symbolizing economic progress and investment success
Analytical Trading Dashboard with Rising Candlestick Charts
Futuristic Neon Trading Dashboard with Candlestick Chart and Pixelated Data Globe Overlay
Holographic Battery Icon Over Stock Market Trading Board
Dynamic Stock Market Graphs with Finance Data
Premium
Man interacts with digital data on tablet during late evening at home while studying financial trends and analyzing graphs
Abstract Financial Data Display with Analytical Graphs
Dynamic Analysis of Stock Market Trends and Patterns
DNA Strands Overlay on Digital Data Analysis Graph
Candlestick and line market chart visualizing stock performance with percentage gain labels
Premium
Bright neon sign displays Money Plan. Background shows financial charts, green and red lines indicating market fluctuations. Dark setting.
Financial Market Love: Red Hearts and Economic Graph Integration
Dynamic Stock Market Graphs Showing Fluctuating Trends
Global Financial Data Interface with Rotating Globe Overlay
Global Financial Data Displayed with Digital Earth
Global Financial Market Positive Trend Visualization
Stock Market Graph and Data Analysis
Candlestick chart showing sharp peak and decline with moving averages on trading dashboard
Colorful Digital Financial Analytics Interface for Data Visualization
Premium
Finger presses the withdraw button on a dark digital interface displaying neon financial charts
Premium
Businessman showing financial dashboard with virtual data analysis interface and charts in futuristic digital display concept on dark background.
Premium
Man using smartphone displaying financial data, investment growth, home office, modern living room concept.
Innovative Digital Finance Data Display on Dark Interface
Dynamic Financial Graphs Illustrating Market Trends and Data
Financial Data Analysis with Stock Market Graphs
Premium
Crystal clear bubble reflecting colorful financial stock market charts and graphs on blurred digital display background
Financial Market Trends with Ukraine Flag Symbolism in Background
Digital Financial Data Display with Graphs and Statistics
Financial Data Flowing Over Chemical Structures
Illuminated Financial Data Chart Display on Dark Backdrop
Premium
Woman smiles near trading platform. She looks on stock market data at multiple monitors. Female trader works with graph charts at office. Businesswoman analyzes digital investments, financial reports.
Financial Data Skewing Over Chemical Structure Background
Global Financial Data and Technology Interface
Financial Data Superimposed on Futuristic Chemical Structures
Financial Data and Stock Market Analysis with Cityscape
Premium
This image illustrates a digital financial growth chart over a keyboard, symbolizing business trends, market analysis, and technological advancements in the finance sector. Copula
Abstract Globe of Digital Finance Icons and Market Data Background
Tech-Focused Financial Data Visualization with Rising Graphs
Dynamic Financial Graphs and Data Fluctuations
Abstract Digital Finance Graph Interface Display
Premium
Industrial worker in hardhat monitoring data streams on multiple monitors. The charts display financial data.
Digital Stock Market Growth with Data Visualization
Dynamic Financial Data Visualization on Grid
Premium
Businessman interacting with futuristic hologram interface displaying financial data and digital charts on a dark blue background. Concept of analytics.
Financial Data Visualization with Dynamic Graphical Analysis
Finance Data Learning: Economic Trends and Market Analysis
Premium
A close-up shot of a colorful 3D pie chart resting on a digital screen displaying various financial graphs and data.  The image is dark with vibrant chart colors
Digital Graphs and Molecular Structures on Gradient Background
Market dashboard displaying candlestick chart, volume profile and moving averages
Innovative Financial Data Integration with Digital Brain Concept
Colombian Stock Market Data Amid Colored Background
Rising Green Line on Financial Digital Display
Dynamic Financial Data Charts on Dark Digital Background
Digital Financial Analytics Merging with Chemical Data
Glowing Stock Market Financial Chart Data Overlay
Digital Interface of Rising Stock Market Trends
Dynamic Financial Data Chart on Blue Background
Financial Data Charts and Graphs on Digital Interface
Dynamic Stock Market Data and Cityscape Background
Futuristic Financial Dashboard Showing Candlestick Trends, Dotted Ribbon Path and Alerts
Complex Financial Graphs Showing Market Changes and Data Analysis
Financial Data Trends on Stock Market Graph
Digital Financial Chart Showing Growth and Dynamic Indicators
Futuristic Financial Data Display with Stock Market Analysis
Futuristic Stock Market Concept with Social Media Integration
Premium
Desktop computer displays business analytics with financial charts, graphs, and data visualizations, alongside a desk lamp, a cup of coffee, and a potted plant set on a clean, white surface,
Inflation Analytics: Graphic Representation of Stock Market Trends
Financial Graph Overlay on Power Lines at Dusk
Abstract Financial Data with Digitally Enhanced Graphs
Dynamic Financial Graph Analyzing Market Trends
Premium
Analyzing real-time financial market trends and stock performance with vibrant candlestick charts and data displayed on a digital screen, symbolizing investment analysis and global economic activity
Abstract Financial Data Over Cityscape Imagery
Financial Data Analysis with Growth Trend Arrows on Digital Interface
Financial Data Visualization with Increasing Graph Trend
Futuristic Financial Charts with Virtual Arrows
Financial Data Market Chart Analysis with Digital Overlay
Digital Interface Merging Financial Analysis with Chemical Formulas
Financial Data with Chemical Structures Displayed on Graph
Dynamic Stock Market Analysis with Blue Graphs and Percentages
Stock Market Graph Reflecting Financial Trends and Analysis
Genomic Data and Digital Interface Conceptual Display
Dynamic Financial Data Processing Showing Stock Market Interface
Digital Financial Data Analytics on Modern Display
Innovative Technology Dashboard Displaying Analytics and Trends
Financial Data and Stock Market Trends Overlaying Cityscape
Dynamic Stock Market Graphs and Financial Data Visualization
Digital Globe with Stock Market Data and Network Icons
Futuristic Financial Trading Graph and Data Visualization
Rising Stock Market Trend with Digital Data Analytics
Digital Financial Data Visualization on Grid Display
Data Processing and Analytics on Global Finance Map
Premium
A professional analyzing data trends with hands raised, showcasing vibrant graphs and charts indicating growth and analytics.
Premium
Data visualization of a rising trend.  Complex graph displays increasing values over time.  Dynamic graphic with glowing lines representing financial data
Combining Renewable Energy with Dynamic Financial Data Visualization
Security Hologram Over Digital Stock Market Analysis
Global Data Projection Showing Stock Market Trends with Digital Globe
City Skyline Merging with Financial Graphs Demonstrating Market Trends
Premium
Man celebrating in front of multiple computer screens displaying financial charts and data
Dynamic Stock Market and Financial Data Analysis Concept
Dynamic Financial Data with Fluctuating Graph Lines
Stock Market Data Analysis with Digital Security Element
Financial Graphs Displayed Over Aerial City View
Premium
To male teammates engaged in formal business meeting, presentation, or strategy planning in modern conference room, reviewing data displayed on large digital screen with charts and graph. Strategizing
Financial Data Analysis with Chemistry Theme
Analyzing Financial Graphs with Real-Time Data Trends
Dynamic Stock Market Ticker and Graph Analysis
Explore More Free Stock Images