
- Home >
- Stock Photos >
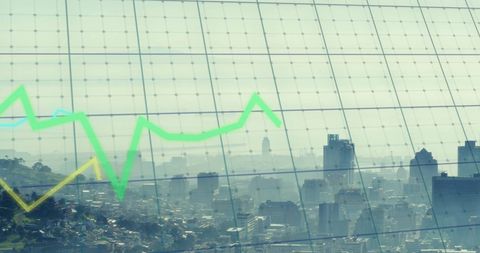
- Financial Data Visualization with Cloudscape Background
Financial Data Visualization with Cloudscape Background Image

Illustrates the intersection of finance and technology with a serene backdrop, suggesting environmental sustainability. Useful for financial analysis reports, presentations on economic trends, or discussions on integrating technology with environmental considerations.
Powered by 


downloads
Tags:
More
Credit Photo
If you would like to credit the Photo, here are some ways you can do so
Text Link
photo Link
<span class="text-link">
<span>
<a target="_blank" href=https://pikwizard.com/photo/financial-data-visualization-with-cloudscape-background/36f84b003df311d49f0c6f98eb80ddc7/>PikWizard</a>
</span>
</span>
<span class="image-link">
<span
style="margin: 0 0 20px 0; display: inline-block; vertical-align: middle; width: 100%;"
>
<a
target="_blank"
href="https://pikwizard.com/photo/financial-data-visualization-with-cloudscape-background/36f84b003df311d49f0c6f98eb80ddc7/"
style="text-decoration: none; font-size: 10px; margin: 0;"
>
<img src="https://pikwizard.com/pw/medium/36f84b003df311d49f0c6f98eb80ddc7.jpg" style="margin: 0; width: 100%;" alt="" />
<p style="font-size: 12px; margin: 0;">PikWizard</p>
</a>
</span>
</span>
Free (free of charge)
Free for personal and commercial use.
Author: Authentic Images
Similar Free Stock Images

Premium


Premium


Premium


Premium


Premium

Premium

Premium


Premium


Premium

Premium


Premium


Premium


Premium


Premium


Premium


Premium


Premium


Premium


Premium


Premium


Premium


Premium


Premium


Premium


Premium


Explore More Free Stock Images