- Home >
- Stock Photos >
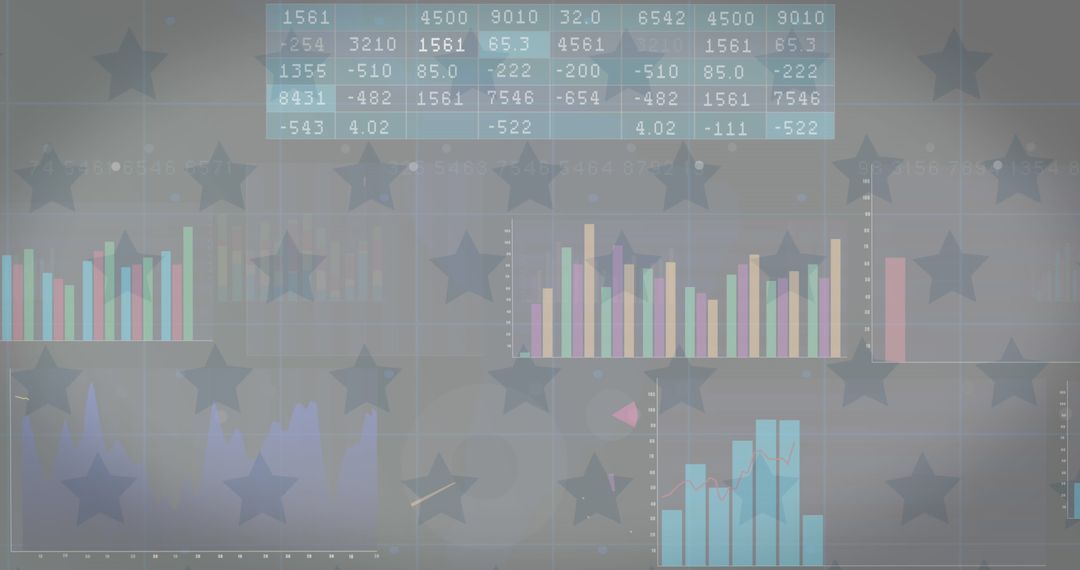
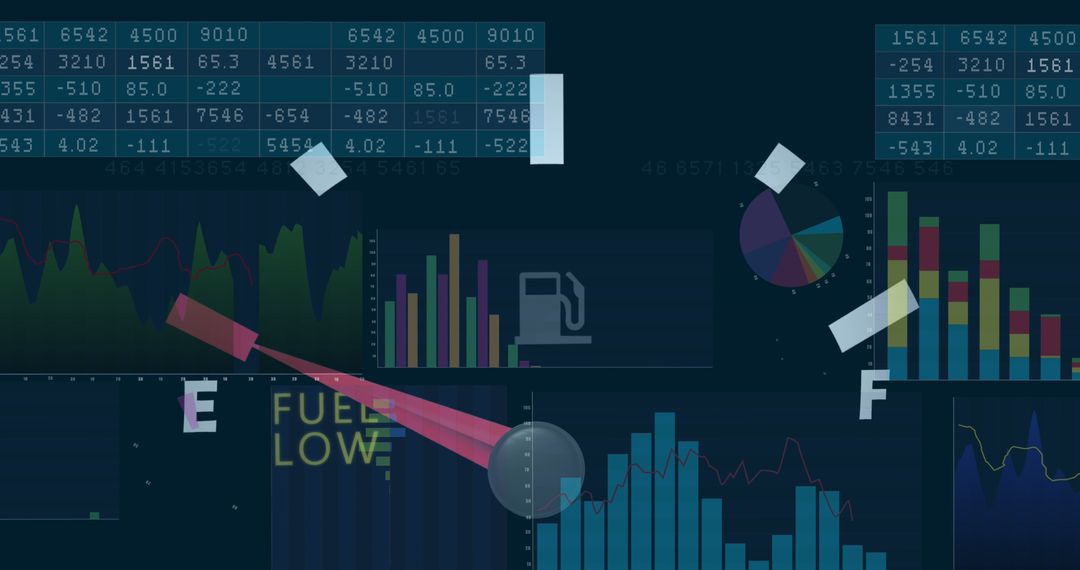
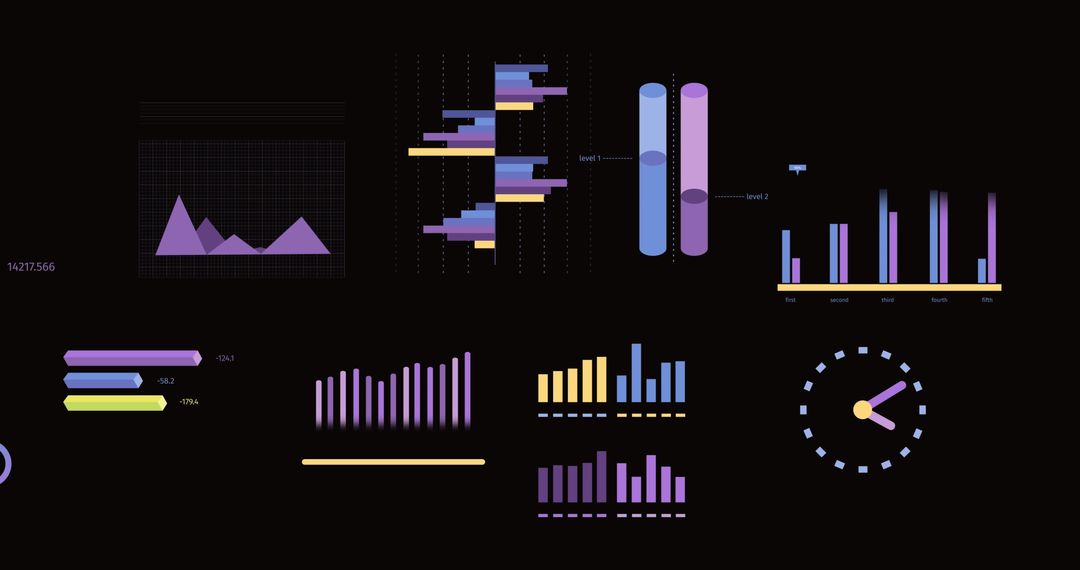
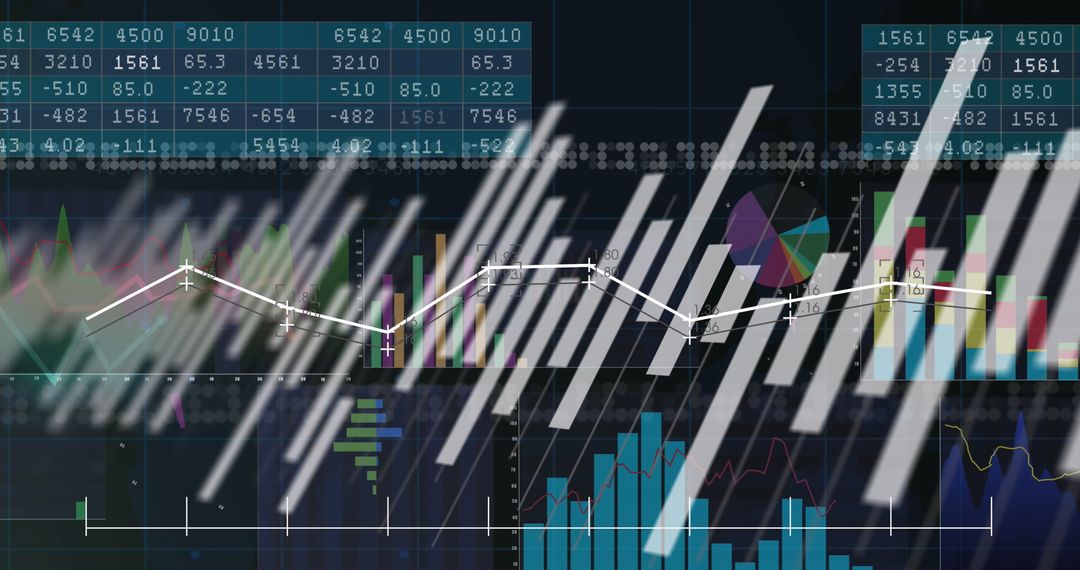
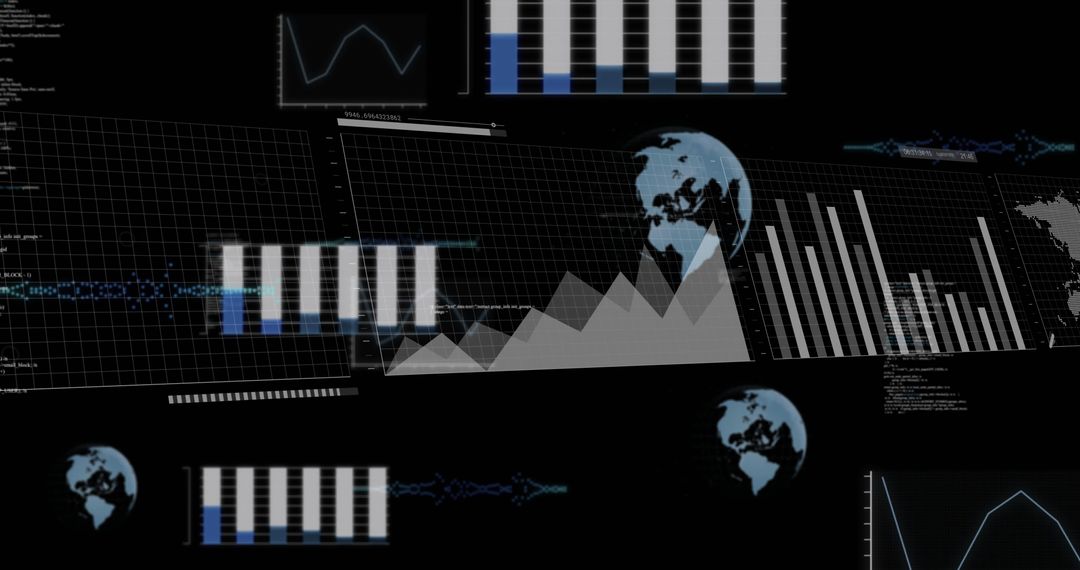
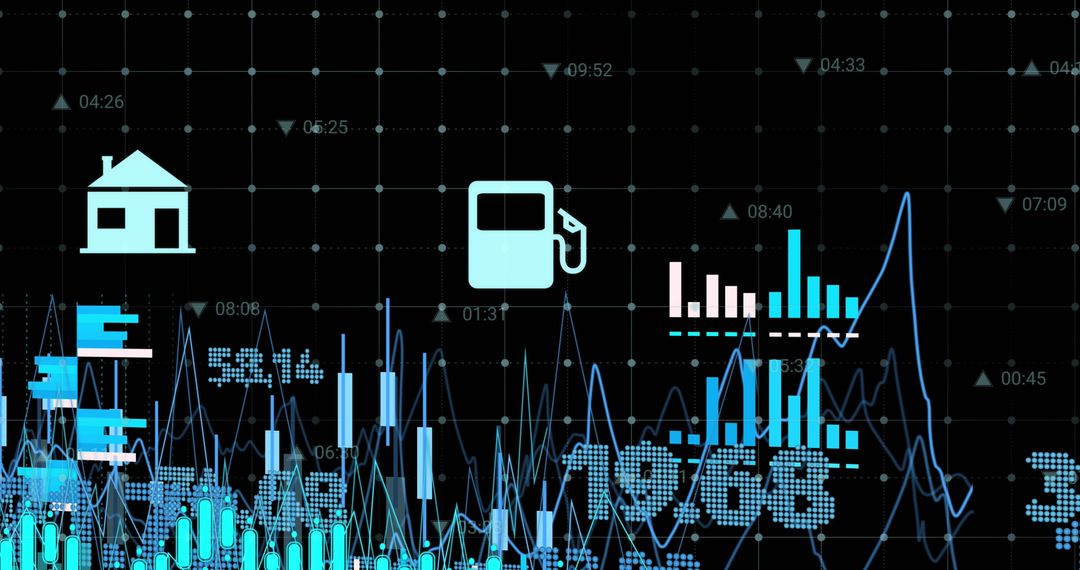
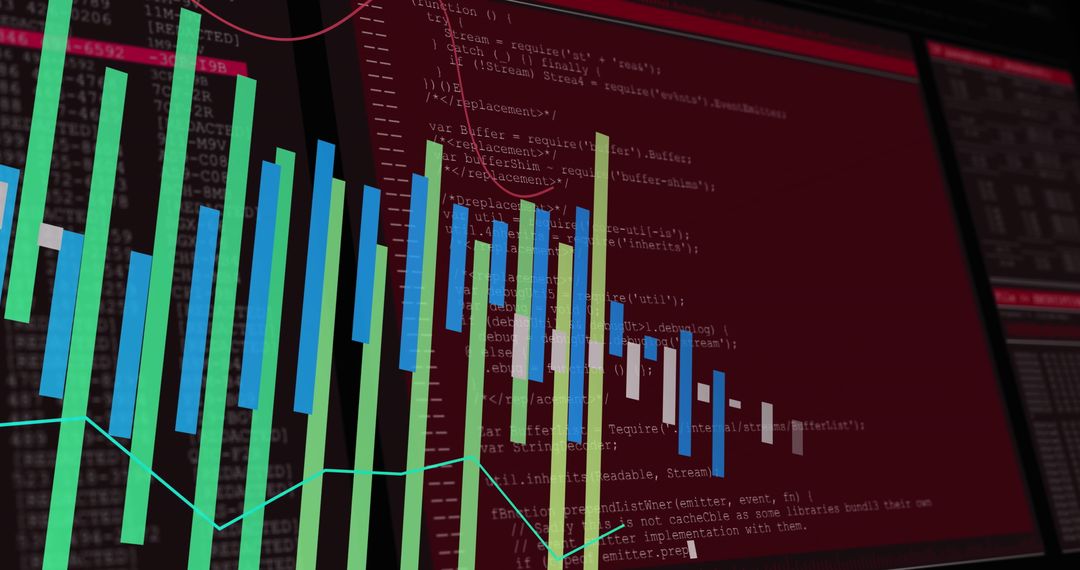
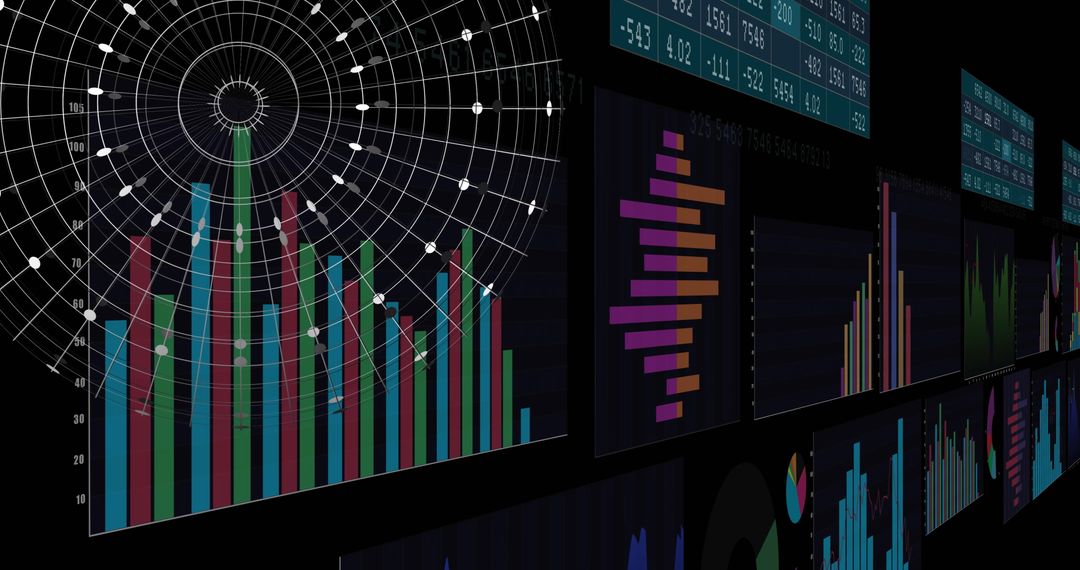
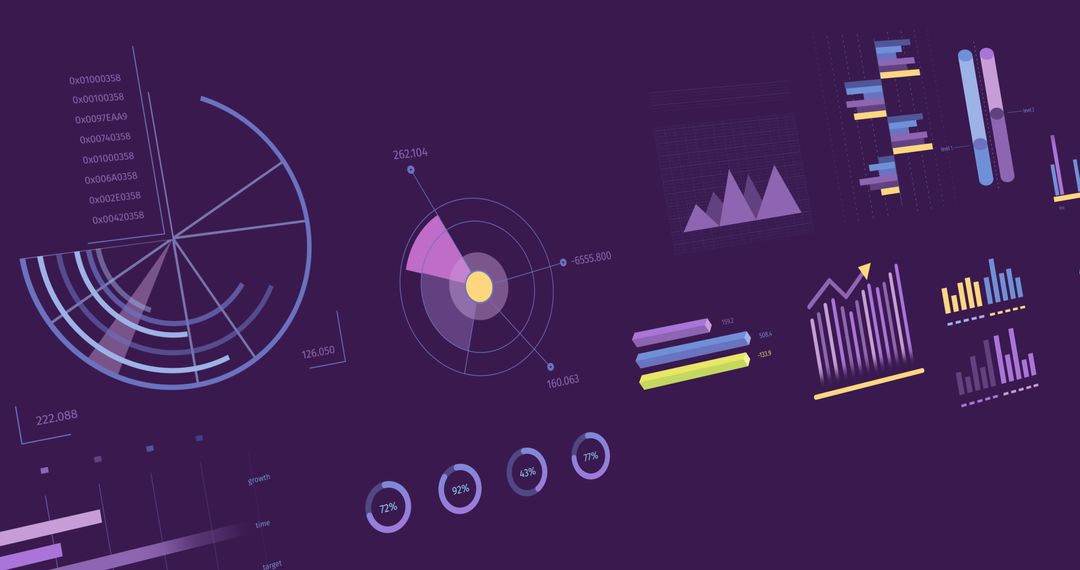
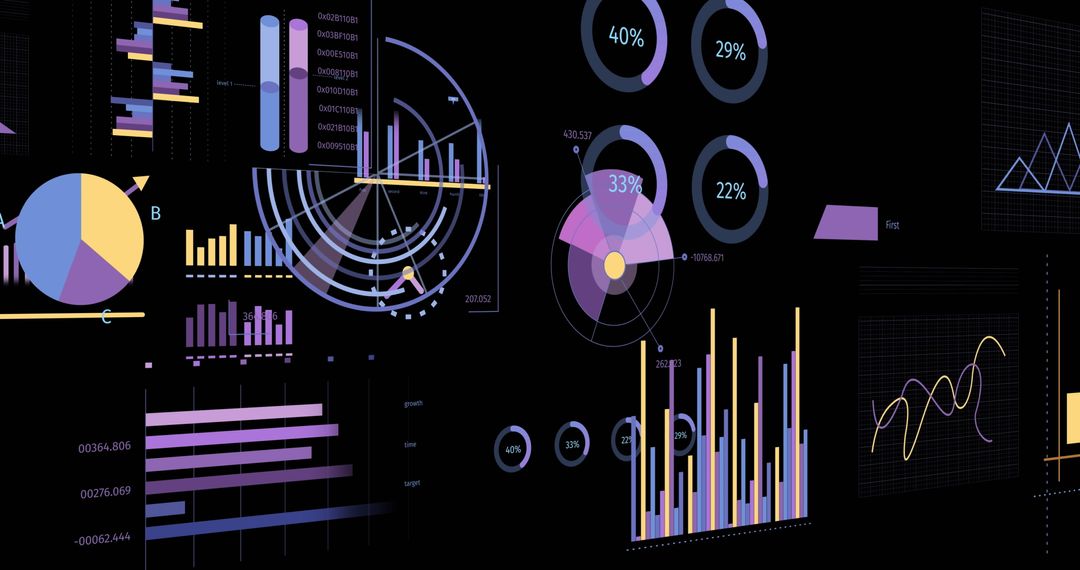
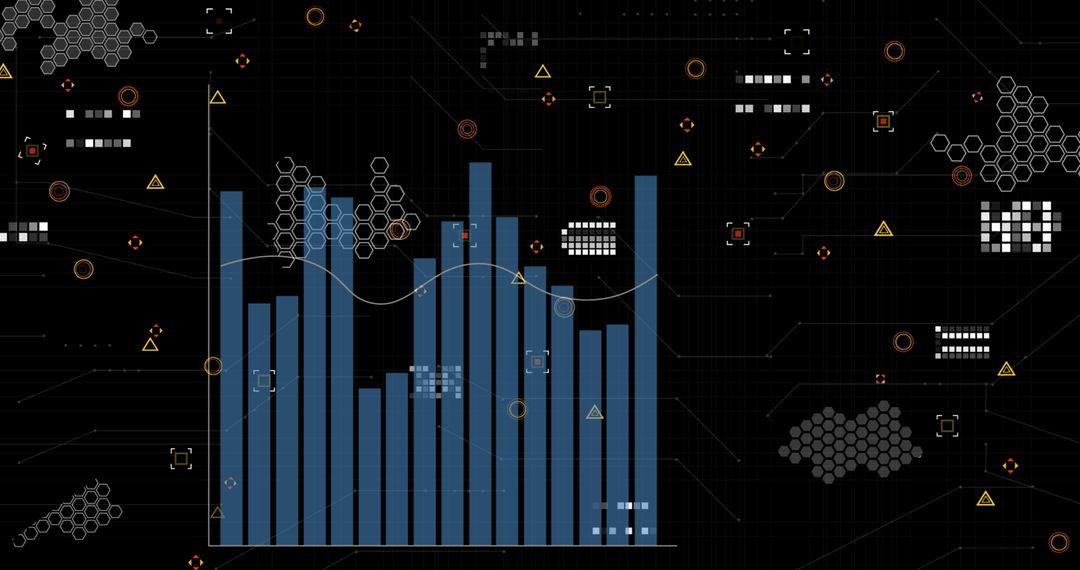
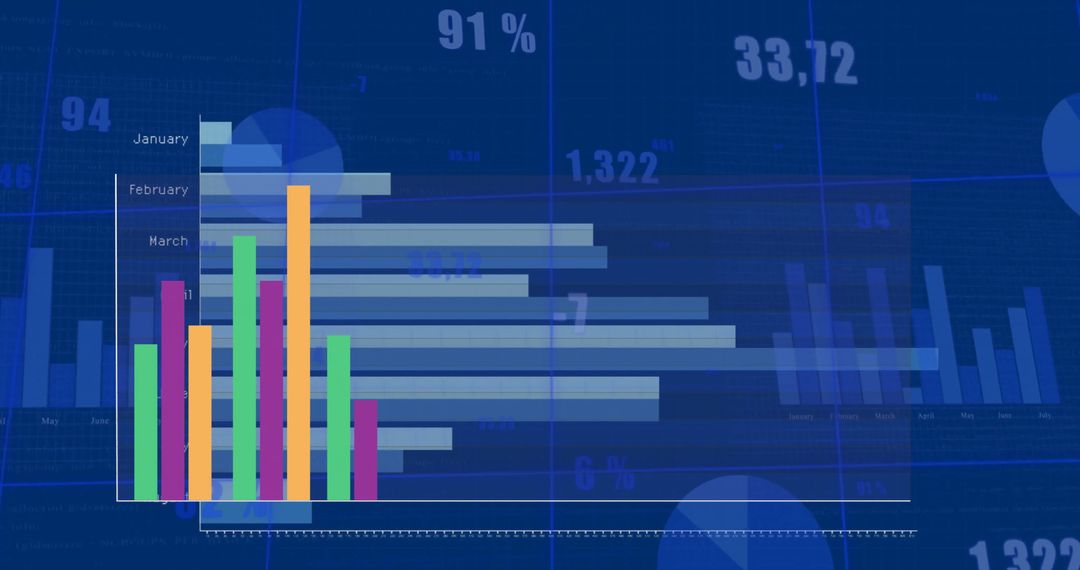
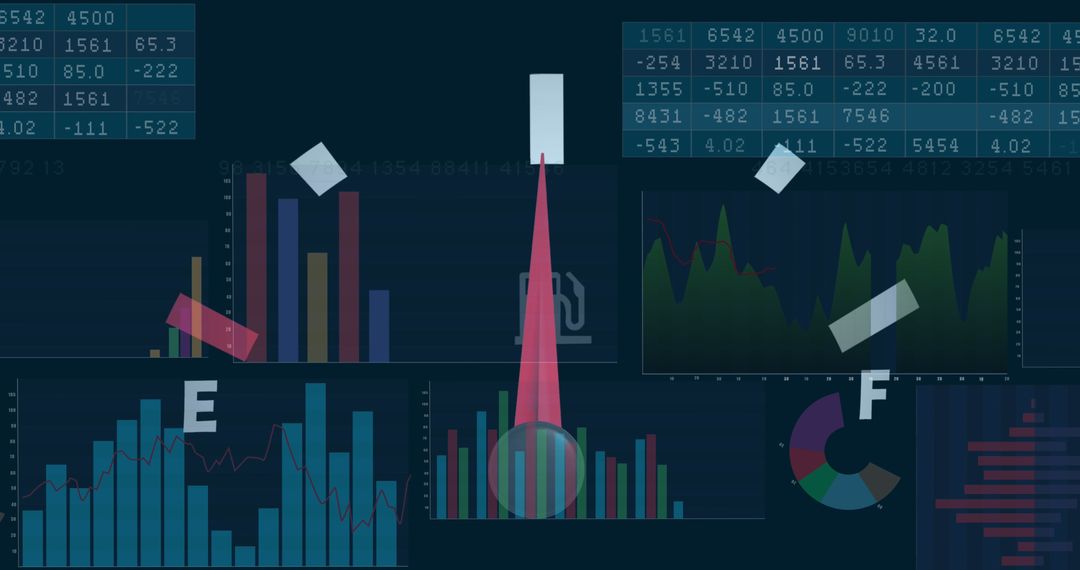
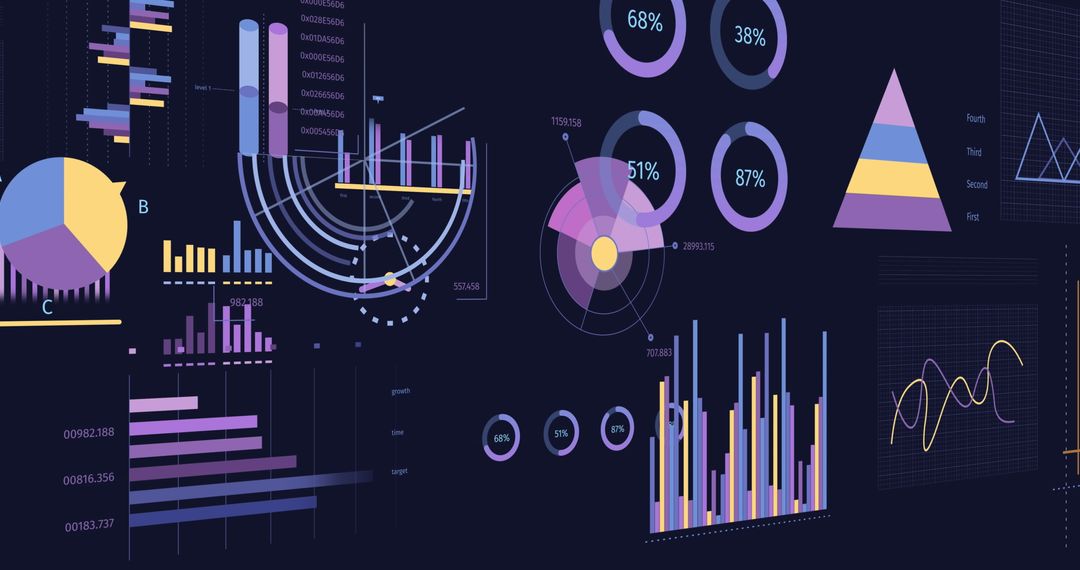
- Financial Data Visualization with Colored Charts on Dark Background
Financial Data Visualization with Colored Charts on Dark Background Image

Vibrant and vivid financial charts displayed on a dark background represent various aspects of business analytics such as data processing and global finance concepts. This visual can be used in presentations, reports, or articles discussing financial trends, data analysis techniques, or economic strategies. It is perfect for technology-driven finance environments.
Powered by  - Get 15% off with code: PIKWIZARD15


2
downloads
downloads
Tags:
More
Credit Photo
If you would like to credit the Photo, here are some ways you can do so
Text Link
photo Link
<span class="text-link">
<span>
<a target="_blank" href=https://pikwizard.com/photo/financial-data-visualization-with-colored-charts-on-dark-background/a2059d3dd27384133f0cd190377862d9/>PikWizard</a>
</span>
</span>
<span class="image-link">
<span
style="margin: 0 0 20px 0; display: inline-block; vertical-align: middle; width: 100%;"
>
<a
target="_blank"
href="https://pikwizard.com/photo/financial-data-visualization-with-colored-charts-on-dark-background/a2059d3dd27384133f0cd190377862d9/"
style="text-decoration: none; font-size: 10px; margin: 0;"
>
<img src="https://pikwizard.com/pw/medium/a2059d3dd27384133f0cd190377862d9.jpg" style="margin: 0; width: 100%;" alt="" />
<p style="font-size: 12px; margin: 0;">PikWizard</p>
</a>
</span>
</span>
Free (free of charge)
Free for personal and commercial use.
Author: People Creations
Similar Free Stock Images

Premium


Premium


Premium


Premium


Premium


Premium


Premium


Premium

Premium


Premium


Premium


Premium


Premium


Premium

Premium


Premium

Premium


Premium


Premium


Premium


Premium


Premium


Premium


Premium