
- Home >
- Stock Photos >
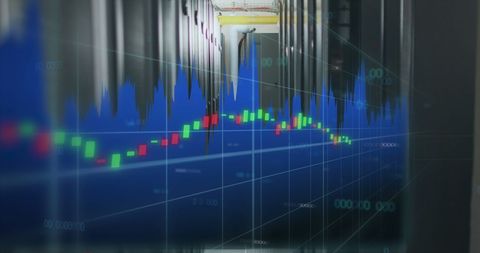
- Financial Data Visualization with Currency Analysis Indicators
Financial Data Visualization with Currency Analysis Indicators Image

Digitized presentation of financial data with stock charts and currency analysis, ideal for illustrating concepts in global finance, trading platforms, or sophisticated financial software systems. Useful for marketing materials, finance educational content, or technology showcases emphasizing data analysis and investments.
Powered by 


downloads
Tags:
More
Credit Photo
If you would like to credit the Photo, here are some ways you can do so
Text Link
photo Link
<span class="text-link">
<span>
<a target="_blank" href=https://pikwizard.com/photo/financial-data-visualization-with-currency-analysis-indicators/cd461186f46cd11116c9df7871d5ac84/>PikWizard</a>
</span>
</span>
<span class="image-link">
<span
style="margin: 0 0 20px 0; display: inline-block; vertical-align: middle; width: 100%;"
>
<a
target="_blank"
href="https://pikwizard.com/photo/financial-data-visualization-with-currency-analysis-indicators/cd461186f46cd11116c9df7871d5ac84/"
style="text-decoration: none; font-size: 10px; margin: 0;"
>
<img src="https://pikwizard.com/pw/medium/cd461186f46cd11116c9df7871d5ac84.jpg" style="margin: 0; width: 100%;" alt="" />
<p style="font-size: 12px; margin: 0;">PikWizard</p>
</a>
</span>
</span>
Free (free of charge)
Free for personal and commercial use.
Author: Authentic Images
Similar Free Stock Images

Premium


Premium


Premium


Premium

Premium

Premium

Premium


Premium


Premium


Premium


Premium


Premium


Premium


Premium


Premium

Premium

Premium

Premium


Premium


Premium


Premium


Premium


Premium


Premium


Premium


Explore More Free Stock Images