- Home >
- Stock Photos >
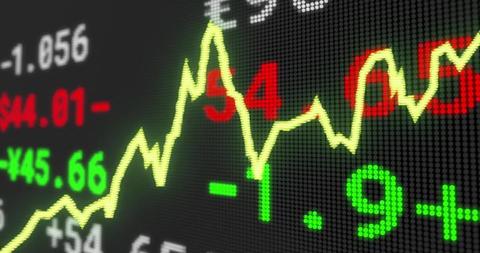
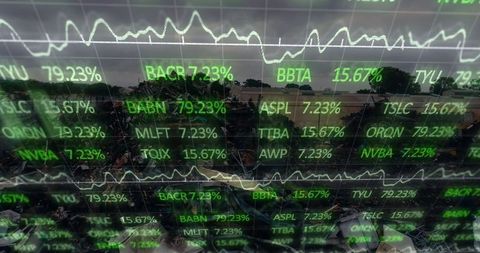
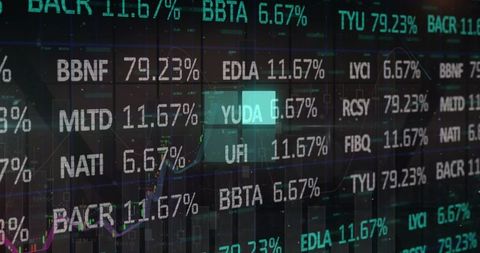
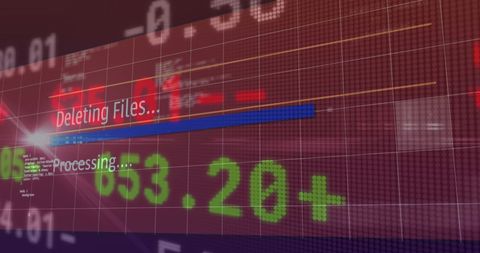
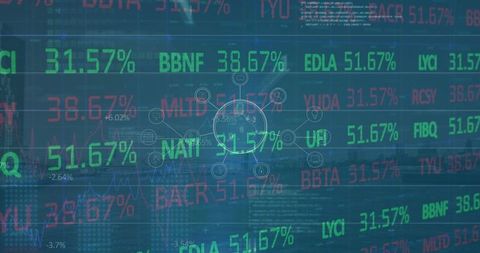
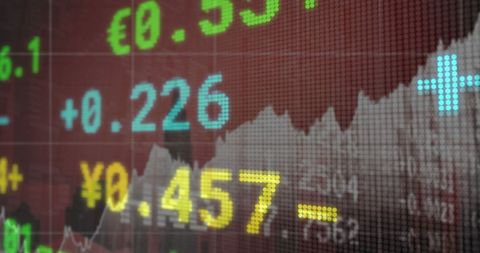
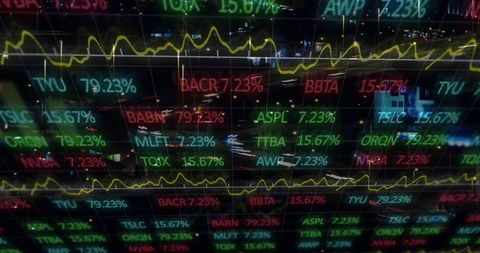
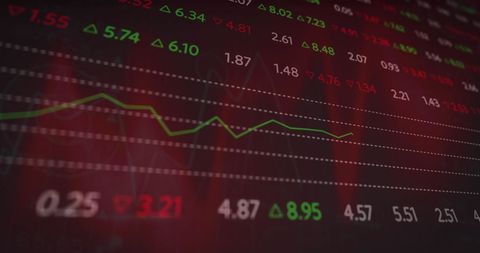
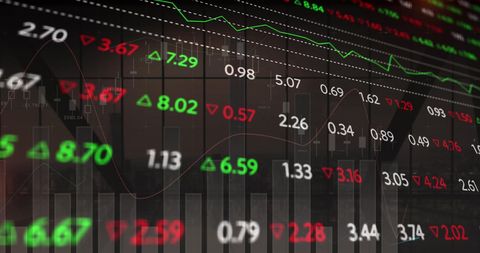
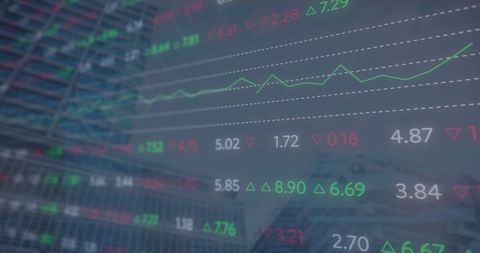
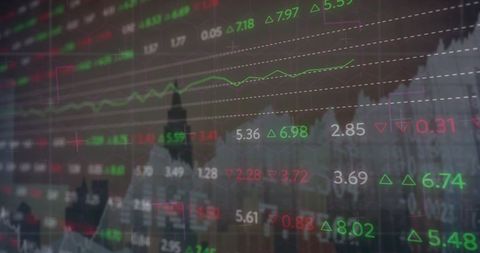
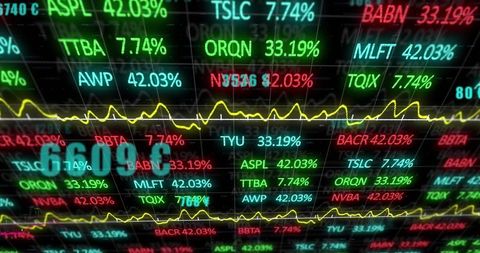
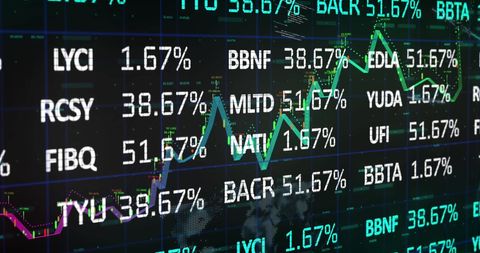
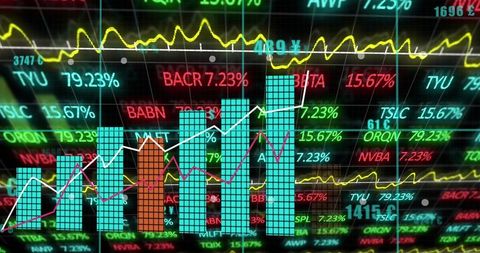
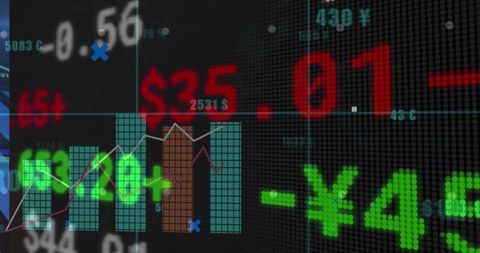
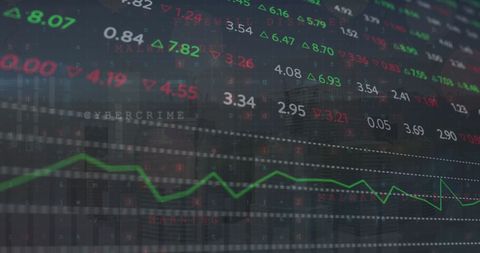
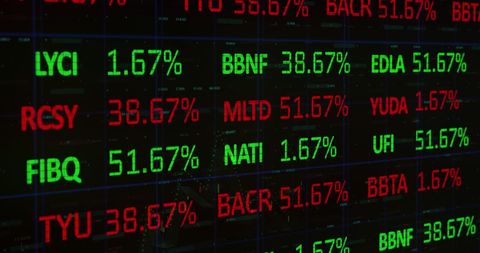
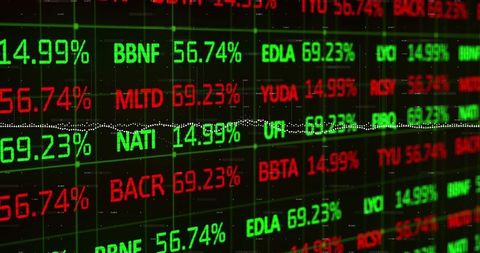
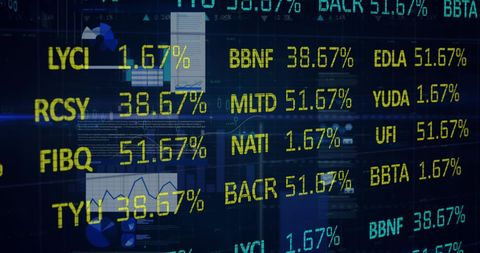
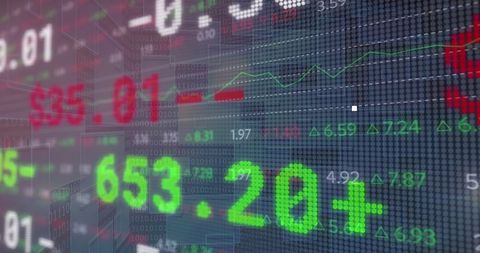
- Financial Data Visualization with Digital Interface
Financial Data Visualization with Digital Interface Image
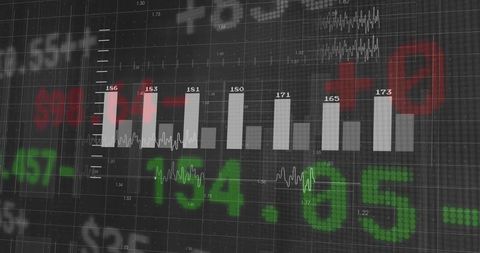
Offers insight into financial market analysis via a digital interface with a focus on bar chart visualization, useful for presentations on investment trends, stock market insights, economics-related talks, or inclusion in technology and finance articles to represent data-driven business intelligence.

downloads
Tags:
More
Credit Photo
If you would like to credit the Photo, here are some ways you can do so
Text Link
photo Link
<span class="text-link">
<span>
<a target="_blank" href=https://pikwizard.com/photo/financial-data-visualization-with-digital-interface/04a958759ab2e278b47a4df4b315b6c3/>PikWizard</a>
</span>
</span>
<span class="image-link">
<span
style="margin: 0 0 20px 0; display: inline-block; vertical-align: middle; width: 100%;"
>
<a
target="_blank"
href="https://pikwizard.com/photo/financial-data-visualization-with-digital-interface/04a958759ab2e278b47a4df4b315b6c3/"
style="text-decoration: none; font-size: 10px; margin: 0;"
>
<img src="https://pikwizard.com/pw/medium/04a958759ab2e278b47a4df4b315b6c3.jpg" style="margin: 0; width: 100%;" alt="" />
<p style="font-size: 12px; margin: 0;">PikWizard</p>
</a>
</span>
</span>
Free (free of charge)
Free for personal and commercial use.
Author: Creative Art