- Home >
- Stock Photos >
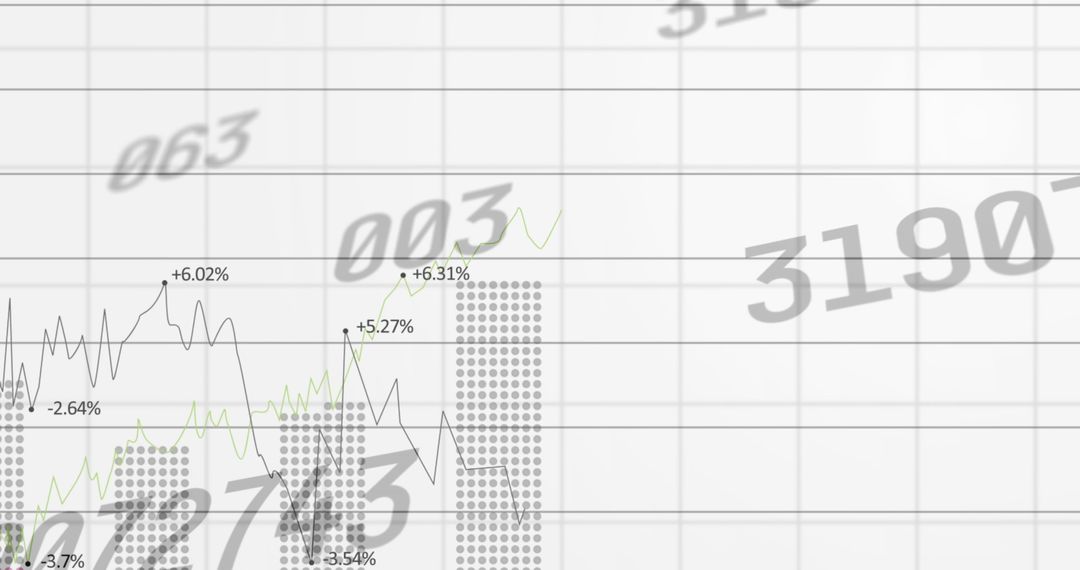
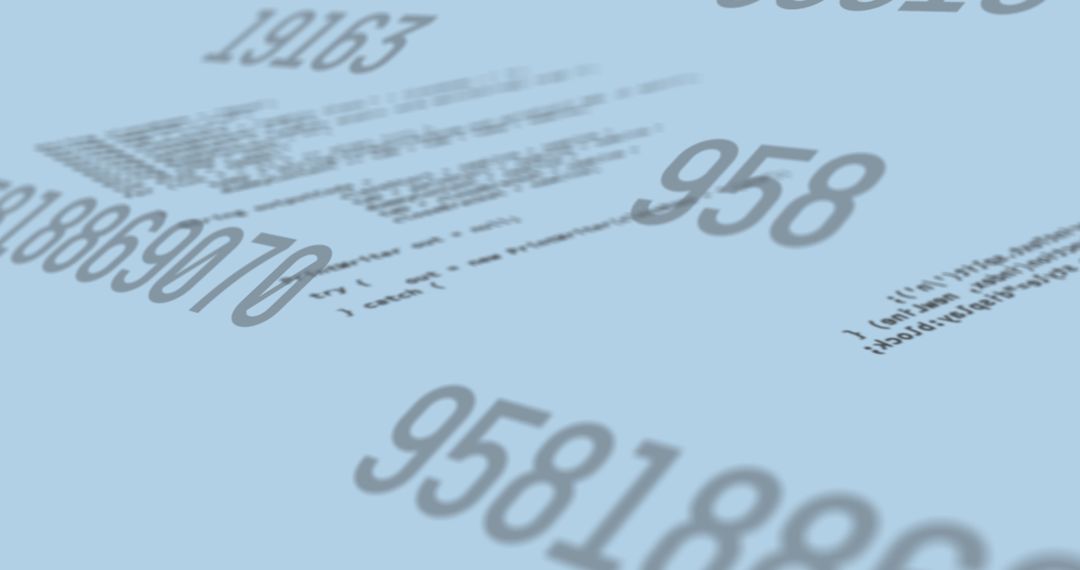
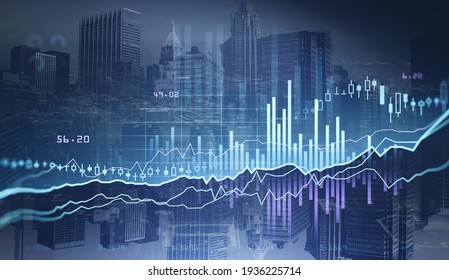
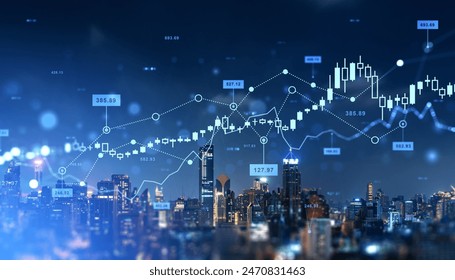
- Financial Data Visualization with Digital Numbers and Bar Graphs
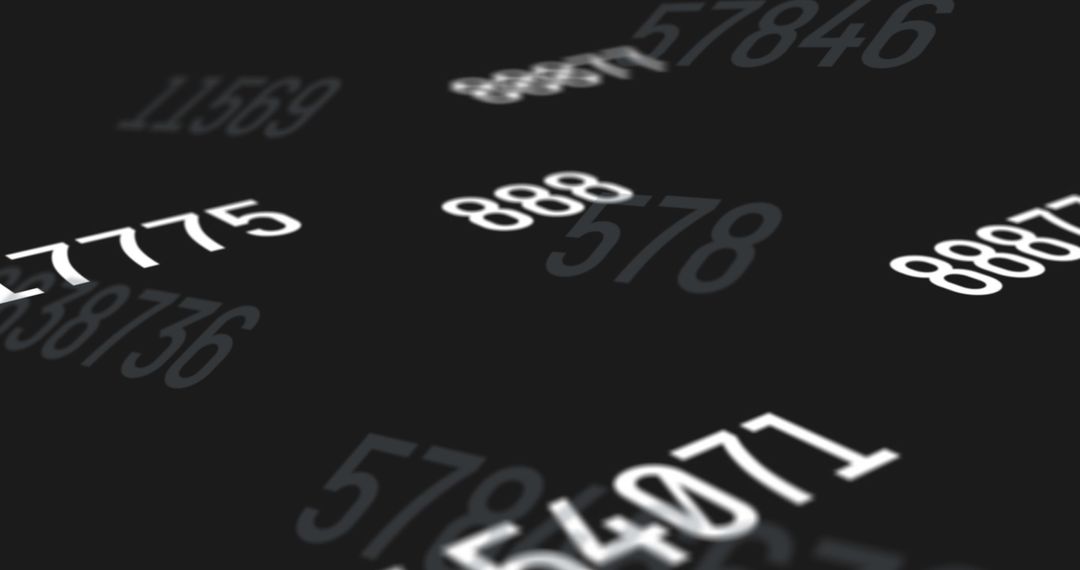
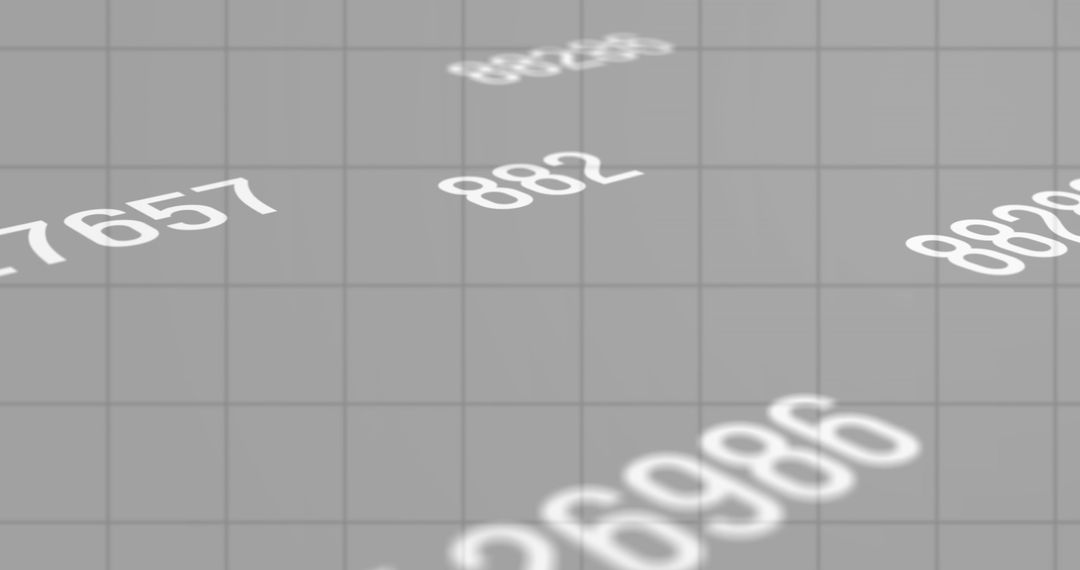
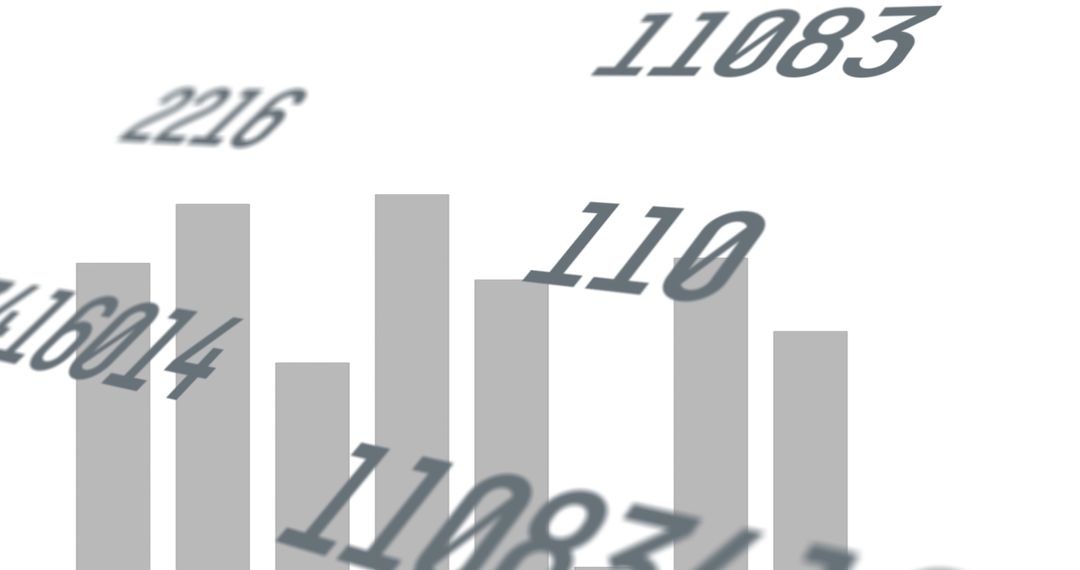
Financial Data Visualization with Digital Numbers and Bar Graphs Image
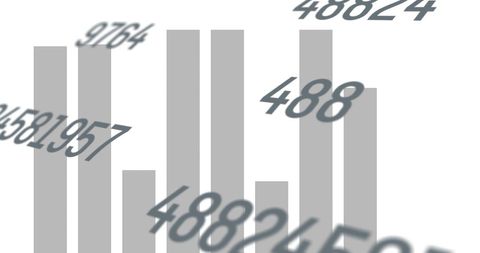
Illustration of overlapping digital numbers against a background of faded bar graphs, symbolizing financial data processing in a global business context. Ideal for conveying the concepts of data analysis, business intelligence, and digital finance in presentations, reports, and financial articles. Useful for businesses and educators to visually communicate insights in the digital finance realm.
Powered by  - Get 15% off with code: PIKWIZARD15


0
downloads
downloads
Tags:
More
Credit Photo
If you would like to credit the Photo, here are some ways you can do so
Text Link
photo Link
<span class="text-link">
<span>
<a target="_blank" href=https://pikwizard.com/photo/financial-data-visualization-with-digital-numbers-and-bar-graphs/faeae355d61ebf9325c530f220038ed6/>PikWizard</a>
</span>
</span>
<span class="image-link">
<span
style="margin: 0 0 20px 0; display: inline-block; vertical-align: middle; width: 100%;"
>
<a
target="_blank"
href="https://pikwizard.com/photo/financial-data-visualization-with-digital-numbers-and-bar-graphs/faeae355d61ebf9325c530f220038ed6/"
style="text-decoration: none; font-size: 10px; margin: 0;"
>
<img src="https://pikwizard.com/pw/medium/faeae355d61ebf9325c530f220038ed6.jpg" style="margin: 0; width: 100%;" alt="" />
<p style="font-size: 12px; margin: 0;">PikWizard</p>
</a>
</span>
</span>
Free (free of charge)
Free for personal and commercial use.
Author: Authentic Images
Similar Free Stock Images

Premium


Premium


Premium


Premium


Premium


Premium


Premium


Premium


Premium


Premium


Premium


Premium


Premium


Premium


Premium


Premium


Premium

Premium


Premium

Premium


Premium


Premium


Premium

Premium