
- Home >
- Stock Photos >
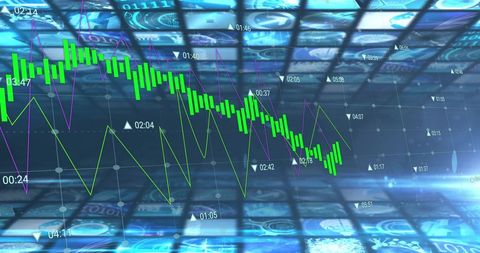
- Financial Data Visualization with Digital World Map and Graphs
Financial Data Visualization with Digital World Map and Graphs Image

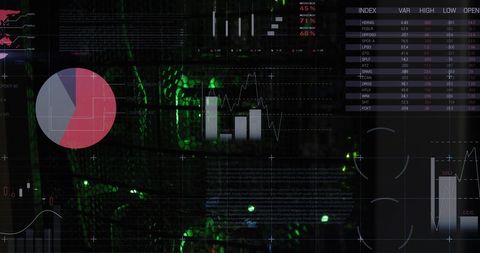
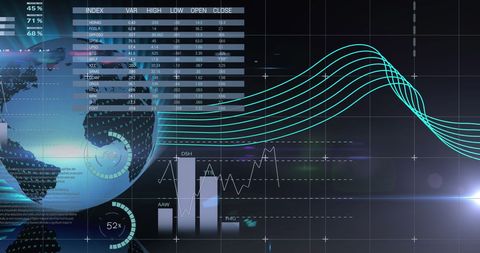
The image shows a digital interface with various financial graphs, world map, and analytical data on a dark background. It highlights the process of big data analysis and its use in financial markets and technology sectors. The visualization emphasizes global trends in investment, economic analysis, and financial technology. Use this for articles or presentations on data analytics, financial market reports, or global business strategies.
Powered by 


downloads
Tags:
More
Credit Photo
If you would like to credit the Photo, here are some ways you can do so
Text Link
photo Link
<span class="text-link">
<span>
<a target="_blank" href=https://pikwizard.com/photo/financial-data-visualization-with-digital-world-map-and-graphs/4b17a74a65cecc80c80c4833f39f1757/>PikWizard</a>
</span>
</span>
<span class="image-link">
<span
style="margin: 0 0 20px 0; display: inline-block; vertical-align: middle; width: 100%;"
>
<a
target="_blank"
href="https://pikwizard.com/photo/financial-data-visualization-with-digital-world-map-and-graphs/4b17a74a65cecc80c80c4833f39f1757/"
style="text-decoration: none; font-size: 10px; margin: 0;"
>
<img src="https://pikwizard.com/pw/medium/4b17a74a65cecc80c80c4833f39f1757.jpg" style="margin: 0; width: 100%;" alt="" />
<p style="font-size: 12px; margin: 0;">PikWizard</p>
</a>
</span>
</span>
Free (free of charge)
Free for personal and commercial use.
Author: People Creations
Similar Free Stock Images

Premium


Premium


Premium


Premium


Premium


Premium


Premium

Premium


Premium

Premium


Premium


Premium


Premium


Premium


Premium


Premium


Premium


Premium


Premium


Premium


Premium


Premium


Premium


Premium


Premium

Explore More Free Stock Images