
- Home >
- Stock Photos >
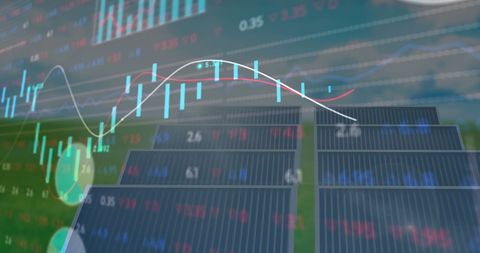
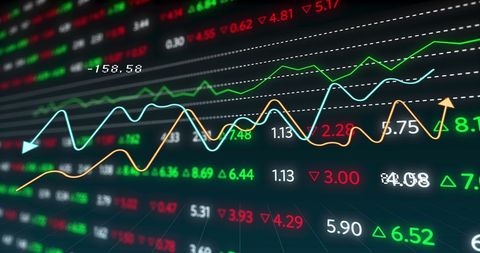
- Financial Data Visualization with Dynamic Chart and Graph Display
Financial Data Visualization with Dynamic Chart and Graph Display Image

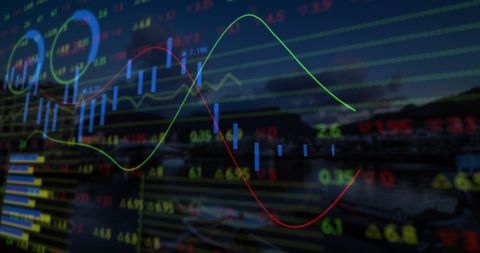
Dynamic display shows statistical and stock market data visualization with charts and graphs. Useful for illustrating concepts in finance, technology, data analysis, economic trends, and business discussions. Ideal for use in digital media, financial reports, or presentations highlighting investment patterns and market analytics.
Powered by 


downloads
Tags:
More
Credit Photo
If you would like to credit the Photo, here are some ways you can do so
Text Link
photo Link
<span class="text-link">
<span>
<a target="_blank" href=https://pikwizard.com/photo/financial-data-visualization-with-dynamic-chart-and-graph-display/3dc0acf95fce179c3c009787964031d6/>PikWizard</a>
</span>
</span>
<span class="image-link">
<span
style="margin: 0 0 20px 0; display: inline-block; vertical-align: middle; width: 100%;"
>
<a
target="_blank"
href="https://pikwizard.com/photo/financial-data-visualization-with-dynamic-chart-and-graph-display/3dc0acf95fce179c3c009787964031d6/"
style="text-decoration: none; font-size: 10px; margin: 0;"
>
<img src="https://pikwizard.com/pw/medium/3dc0acf95fce179c3c009787964031d6.jpg" style="margin: 0; width: 100%;" alt="" />
<p style="font-size: 12px; margin: 0;">PikWizard</p>
</a>
</span>
</span>
Free (free of charge)
Free for personal and commercial use.
Author: Creative Art
Similar Free Stock Images
Premium


Premium

Premium


Premium


Premium


Premium

Premium

Premium


Premium

Premium

Premium

Premium


Premium


Premium


Premium


Premium


Premium


Premium


Premium

Premium


Premium


Premium


Premium


Premium


Premium

Explore More Free Stock Images