
- Home >
- Stock Photos >
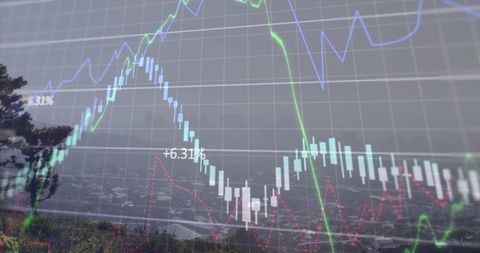
- Financial Data Visualization with Dynamic Graphical Analysis
Financial Data Visualization with Dynamic Graphical Analysis Image

Vivid portrayal of financial charts with intrusive lines and numbers conveys real-time market analysis. Use in finance-related articles, business websites, and educational content on stock market dynamics to illustrate economic movement.
Powered by  - Get 15% off with code: PIKWIZARD15


downloads
Tags:
More
Credit Photo
If you would like to credit the Photo, here are some ways you can do so
Text Link
photo Link
<span class="text-link">
<span>
<a target="_blank" href=https://pikwizard.com/photo/financial-data-visualization-with-dynamic-graphical-analysis/070c61e45a51aec42b19ae8dd8200acf/>PikWizard</a>
</span>
</span>
<span class="image-link">
<span
style="margin: 0 0 20px 0; display: inline-block; vertical-align: middle; width: 100%;"
>
<a
target="_blank"
href="https://pikwizard.com/photo/financial-data-visualization-with-dynamic-graphical-analysis/070c61e45a51aec42b19ae8dd8200acf/"
style="text-decoration: none; font-size: 10px; margin: 0;"
>
<img src="https://pikwizard.com/pw/medium/070c61e45a51aec42b19ae8dd8200acf.jpg" style="margin: 0; width: 100%;" alt="" />
<p style="font-size: 12px; margin: 0;">PikWizard</p>
</a>
</span>
</span>
Free (free of charge)
Free for personal and commercial use.
Author: People Creations
Similar Free Stock Images

Premium


Premium

Premium


Premium

Premium


Premium


Premium


Premium


Premium

Premium

Premium


Premium

Premium


Premium

Premium

Premium

Premium


Premium

Premium


Premium


Premium


Premium


Premium


Premium

Premium


Explore More Free Stock Images