
- Home >
- Stock Photos >
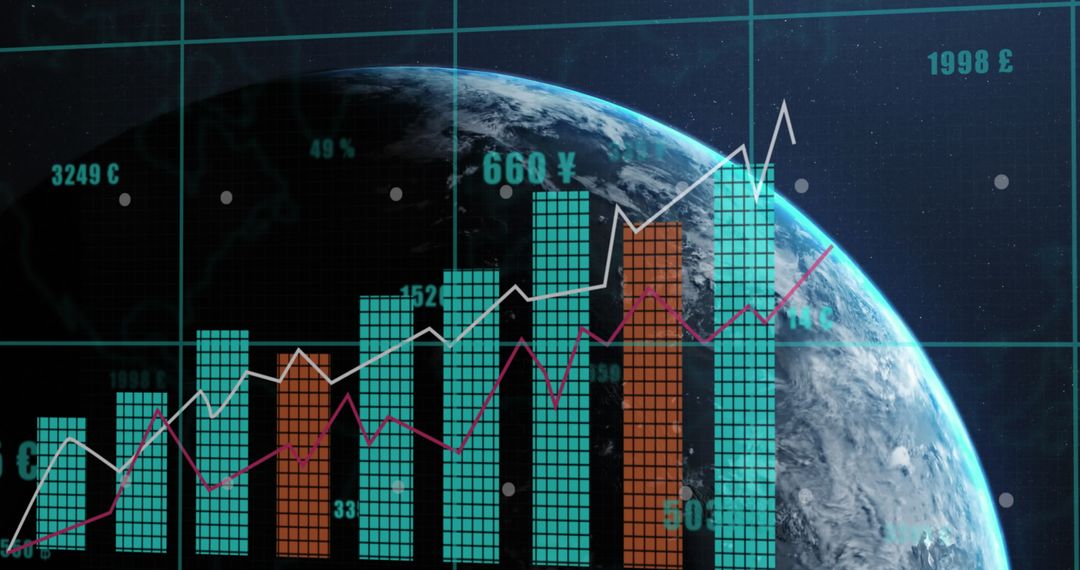
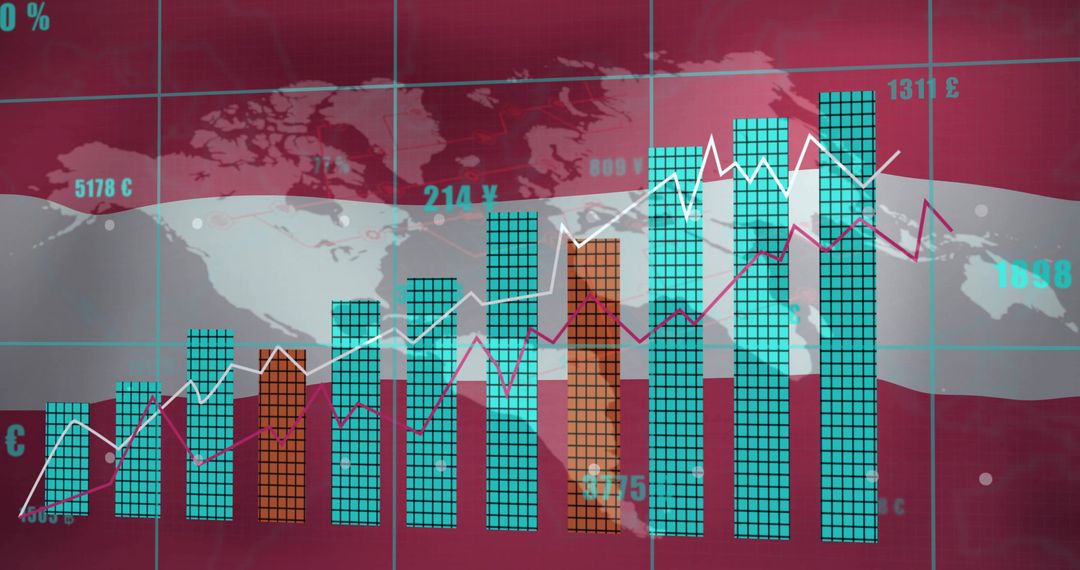
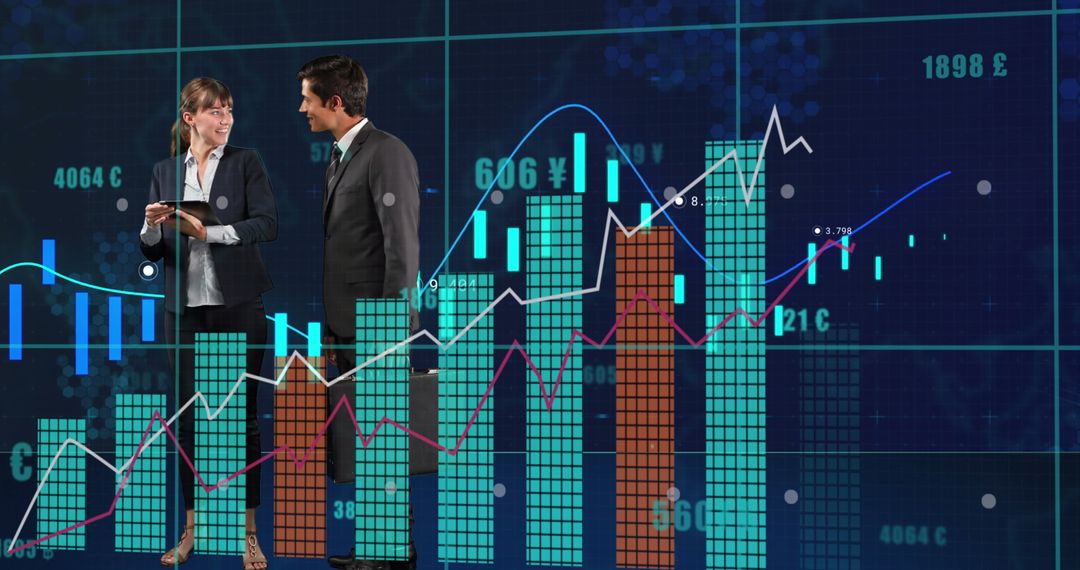
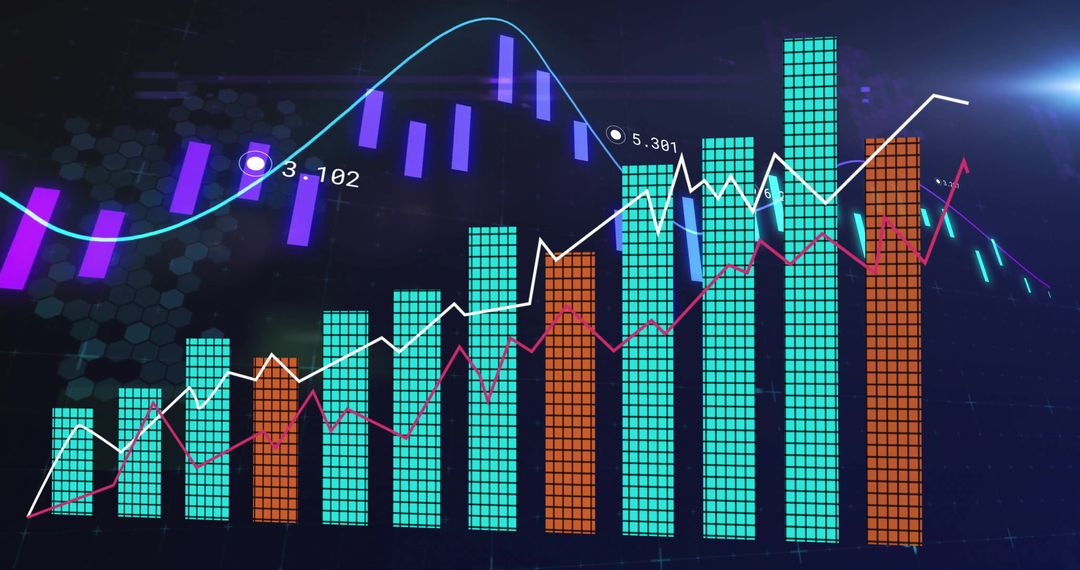
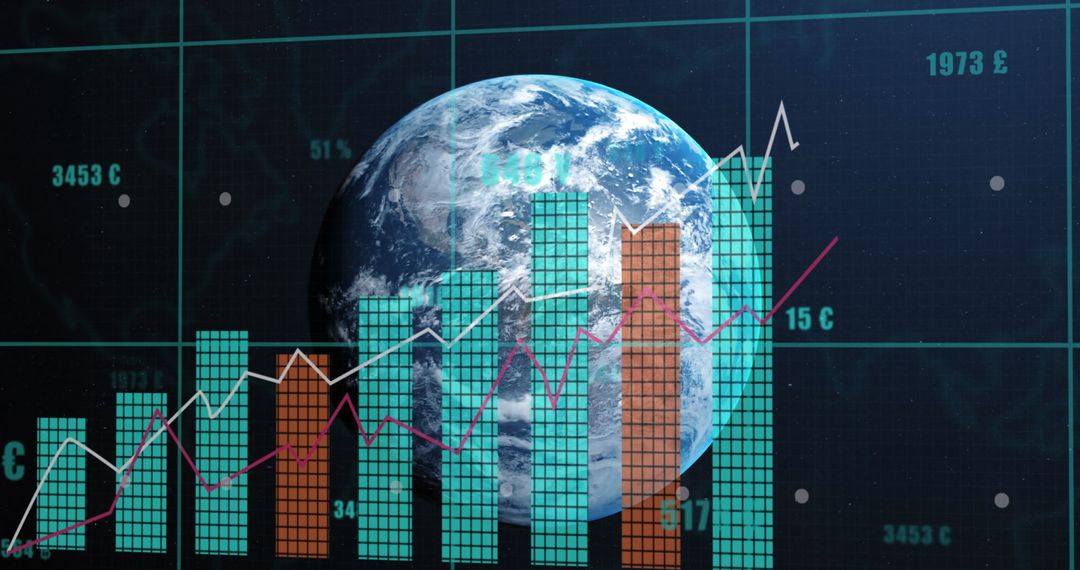
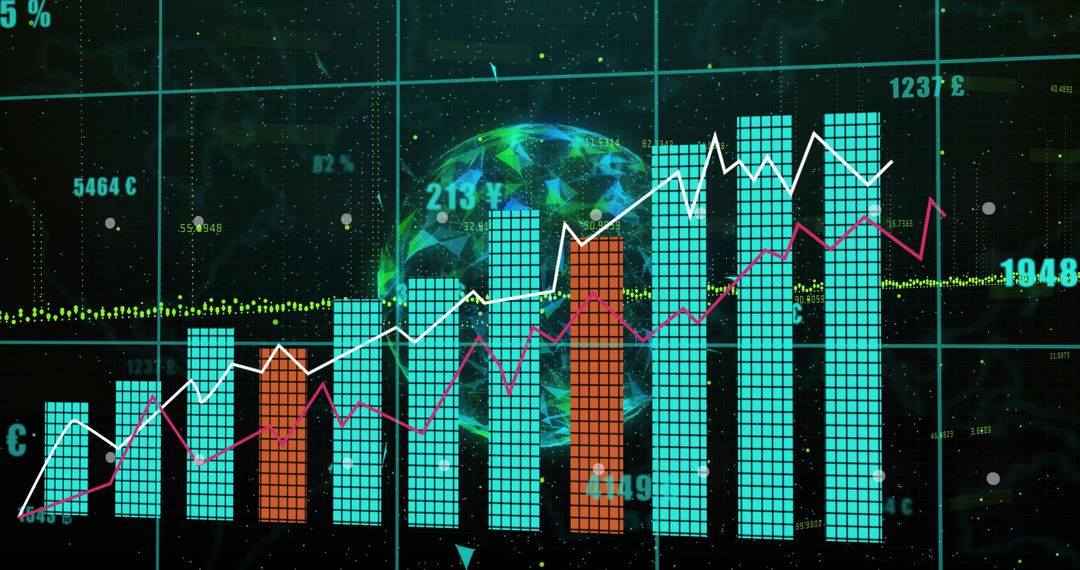
- Financial Data Visualization with Futuristic Bars and Lines
Financial Data Visualization with Futuristic Bars and Lines Image

Vibrant chart displaying statistical data analysis against digital grid backdrop conveys sense of futurism and technology. Useful for illustrating financial reports, economic studies, business tech presentations, or articles about analytics. Highlighting how data-driven technology impacts financial strategies.
Powered by 


0
downloads
downloads
Tags:
More
Credit Photo
If you would like to credit the Photo, here are some ways you can do so
Text Link
photo Link
<span class="text-link">
<span>
<a target="_blank" href=https://pikwizard.com/photo/financial-data-visualization-with-futuristic-bars-and-lines/067a19432727a7553b3480a5bac3075c/>PikWizard</a>
</span>
</span>
<span class="image-link">
<span
style="margin: 0 0 20px 0; display: inline-block; vertical-align: middle; width: 100%;"
>
<a
target="_blank"
href="https://pikwizard.com/photo/financial-data-visualization-with-futuristic-bars-and-lines/067a19432727a7553b3480a5bac3075c/"
style="text-decoration: none; font-size: 10px; margin: 0;"
>
<img src="https://pikwizard.com/pw/medium/067a19432727a7553b3480a5bac3075c.jpg" style="margin: 0; width: 100%;" alt="" />
<p style="font-size: 12px; margin: 0;">PikWizard</p>
</a>
</span>
</span>
Free (free of charge)
Free for personal and commercial use.
Author: Authentic Images
Similar Free Stock Images

Premium


Premium


Premium


Premium


Premium


Premium


Premium


Premium


Premium


Premium


Premium


Premium


Premium


Premium


Premium


Premium


Premium


Premium


Premium


Premium


Premium


Premium


Premium


Premium

