
- Home >
- Stock Photos >
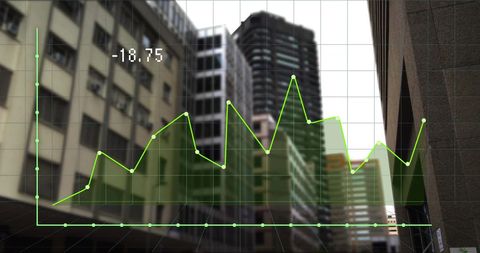
- Financial Data Visualization with Futuristic Cityscape
Financial Data Visualization with Futuristic Cityscape Image

Futuristic financial data visual interposed with an urban skyline. Useful for themes like economic analysis, investing, business growth, or digital finance solutions. Ideal for financial presentations, industry reports, or fintech marketing materials.
Powered by 


downloads
Tags:
More
Credit Photo
If you would like to credit the Photo, here are some ways you can do so
Text Link
photo Link
<span class="text-link">
<span>
<a target="_blank" href=https://pikwizard.com/photo/financial-data-visualization-with-futuristic-cityscape/5c6b6d8f67cb4fb7e8ff54a404ca49da/>PikWizard</a>
</span>
</span>
<span class="image-link">
<span
style="margin: 0 0 20px 0; display: inline-block; vertical-align: middle; width: 100%;"
>
<a
target="_blank"
href="https://pikwizard.com/photo/financial-data-visualization-with-futuristic-cityscape/5c6b6d8f67cb4fb7e8ff54a404ca49da/"
style="text-decoration: none; font-size: 10px; margin: 0;"
>
<img src="https://pikwizard.com/pw/medium/5c6b6d8f67cb4fb7e8ff54a404ca49da.jpg" style="margin: 0; width: 100%;" alt="" />
<p style="font-size: 12px; margin: 0;">PikWizard</p>
</a>
</span>
</span>
Free (free of charge)
Free for personal and commercial use.
Author: Creative Art
Similar Free Stock Images

Premium


Premium


Premium


Premium


Premium


Premium


Premium


Premium


Premium


Premium


Premium


Premium

Premium


Premium


Premium


Premium


Premium


Premium


Premium


Premium

Premium


Premium

Premium


Premium


Premium

Explore More Free Stock Images