1. Home > 
  2. Stock Photos > 
  3. Financial Data Visualization with Futuristic Interface

Financial Data Visualization with Futuristic Interface Image

Financial Data Visualization with Futuristic Interface

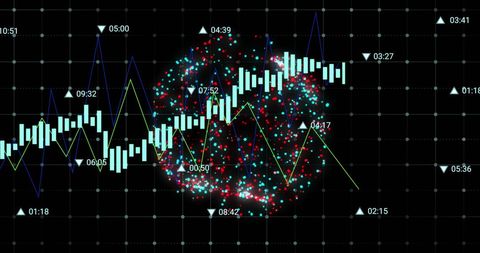
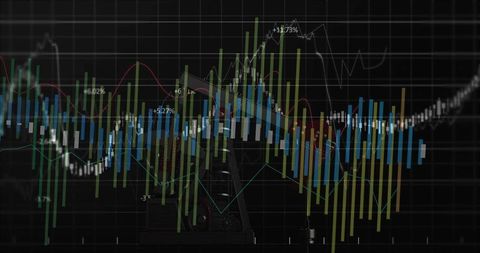
This image showcases a complex interface featuring financial data visualization with various digital icons overlaid. The dark background enhances the clarity of the data, making it ideal for presentations related to stock market trends, technology advancements, or business economics. Use it in financial reports, technology publications, or investment guides to illustrate concepts of digital currency trading and data analysis.

Powered by Shutterstock logo - Get 15% off with code: PIKWIZARD15
Indian rupee background, India economy, finance concept. Indian rupee icon 3d rendering illustration with Indian map and graph - Powered by Shutterstock - Get 15% off with code: PIKWIZARD15Financial and business investment concept. Businessman using smartphone analyze investment in stock market. growth graph chart on screen.  - Powered by Shutterstock - Get 15% off with code: PIKWIZARD15A businessman's hand touches a virtual screen, revealing stock market data analysis icons. This digital interaction offers a glimpse into the modern era of financial analysis and market insights - Powered by Shutterstock - Get 15% off with code: PIKWIZARD15AI(Artificial Intelligence) and Financial Technology concept.Robot Hand holding stacking pile of coins and analyzing the stock market.
, Financial technology, Stock chart, Investment, AI economy. - Powered by Shutterstock - Get 15% off with code: PIKWIZARD15Man technology future lifestyle, digital marketing IOT internet of thing future AI chatbot technology smart device social network, VPN cybersecurity internet futuristic metaverse NFT background - Powered by Shutterstock - Get 15% off with code: PIKWIZARD15

Credit Photo

If you would like to credit the Photo, here are some ways you can do so

Free (free of charge)

Free for personal and commercial use.

Author: People Creations

Similar Free Stock Images

Digital Finance Data Overlaying Futuristic Cityscape
Premium
Man Typing Keyboard Laptop Hand.Project Manager Researching Process.Business Team Working Startup modern Office.Global Strategy Virtual Icon.Innovation Graphs Interfaces.Analyze market stock.Blurred
Digital Stock Market Trends and Financial Growth Analysis
Dynamic Financial Graphs Over Cityscape Background
Financial Data Flow against Urban Skyline Backdrop
Data Analytics and Financial Growth Indicators
Premium
A hand holds a virtual bank surrounded by arrows and percentage signs, symbolizing rising interest rates and banking growth trends.
Dynamic Financial Graph on Digital Background
Dynamic Data Graphs on Digital Interface Background
Dynamic Financial Charts and Graphs Indicating Market Trends
Digital Graphs Representing Data and Analytics on Black Background
Premium
Businessman showing AI technology analyzing financial data stock market. AI learning and business artificial intelligence. Document data management on network, cyber security, digital transformation.
High-Tech Financial Data Analysis Display with Graphs
Graph Showing Stock Market Activity and Financial Data Analysis
Digital Stock Market Analysis with Graphs and Charts
Digital Analysis of Financial Data with Dynamic Graphs
Premium
AI in finance: stock analysis. Hand holds AI brain icon, stock charts. Investment strategy, future tech. Data analysis for traders, stock market trends.
Abstract Financial Data Visualization with Graphs
Digital Graph with Rising and Falling Lines on Grid Background
Dynamic Financial Data Against Urban Skyline
Digital Cityscape with Financial Data Overlay
Premium
Image of stock market data processing over spinning globe against city street. Global economy and business technology concept
Digital Finance Data with Icon Overlay on Blue Background
Dynamic Stock Market Analysis Concept Artwork
Digital Data Wave and Financial Chart with AI Elements
Dynamic Data Graphs Display on Dark Digital Background
Premium
Image of circles, radars, map, computer language, graphs, trading boards over black background. Digitally generated, hologram, report, business, global and stock market concept.
Modern Technology Network with Financial Data Visualization
Global Analytics Dashboard with Zigzag Chart on Dark Interface
Digital Fingerprint on Cybersecurity Dashboard with Data Charts
Colorful Candlestick Chart on Trading Interface
Dynamic Stock Market Graphs Indicating Financial Trends
Dynamic Financial Data Graphs Networking in Global Business
Premium
Up stock market time icon vector for finance, trading, and investment growth visuals. Ideal for economic forecasts, bullish charts, business gains, and global financial planning themes.
Global Financial Data Analysis with World Map Visualization
Dynamic Line Chart with Histogram on Digital Grid Background
Futuristic Global Business Data with Digital Interface
Fluctuating Digital Stock Market Data Chart
Premium
A businessman is working on a digital laptop with a chart and graph, showing growth indicators in 2026; the business is calculating financial data, digital marketing, finance, stock market concept.
Digital Financial Data Analysis with Graphs and Stock Market Trends
Analyzing Financial Market Trends with Data Visualization
Rising Graphs and Interactive Financial Data Analytics Background
Financial Data and Blood Vessels Fusion Exploring Adaptive Business Intelligence
Premium
Image of notification bars, graphs with changing numbers, trading board over black background. Digitally generated, hologram, report, business, stock market, coding, social media concept.
Digital Stock Market Chart and Networking Interface
Dynamic Financial Data Analysis in Digital Interface
Financial Growth Graph and Data Analytics Representation
Dynamic Data Visualization with Financial Charts and 3D Elements
Premium
Business chart with line graph, bar chart and stock numbers on dark blue color background (vector)
Data Visualization on Security Shield Interface for Cyber Security
Digital Chart Display Financial Data Analysis Background Effects
Abstract Data Visualization on Blue Background for Technology Concept
Digital Icons with Financial Data Overlay on Blue Background
Premium
AI visualizes economic caution with smart graphs, alert icons, and data trend analysis, helping businesses respond to financial instability and risk. Artificial intelligence spline
Analyzing Financial Data on Digital World Map Background
Futuristic Financial Data Analysis and Global Connections
Digital Interface Displaying Data Processing and Analytics Visuals
Data Analytics and Technology on Orange Background
Premium
Bear and bull figurines standing on office workspace over numbers with market data overlays. Financial symbols, data analytics, corporate, digital interface, modern, technology, investment
Futuristic Analytics Graph with Cyan-Orange Line Trends
Modern Financial Analysis Display with Dynamic Bar and Line Graphs
Futuristic Financial Dashboard with Analytics and Data Visualization
Dynamic Digital Stock Market Ticker with Growing Graph Trends
Digital Financial Data and Global Business Analytics
Financial Data Overlay on Cityscape Visualizing Market Trends
Premium
Picture female hand touching modern tablet.Investment manager working new private banking project office.Using electronic device.Graphic icons,worldwide stock exchanges interface on screen. Horizontal
Financial Stock Market Data Analysis on Digital Interface
Futuristic Data Processing Animation with Media Icons
Colorful Data Visualization Graphs on Digital Grid
Digital Icons on Data Grid Network Depicting Business Concepts
Premium
Risk Management Work process.Picture Trader working Market Report Document Touching Screen Tablet.Using Worldwide Graphic Icons,Stock Exchange Report.Business Project Startup.Horizontal,Flares Effect
Dynamic Financial Growth Digital Chart Display
Futuristic Digital Finance World Map with Dynamic Data
Financial Data Analysis with Code Interface on Black Background
Abstract Digital Financial Data Chart with Pink Line Oscillations
Premium
Business concept photo.Businessman working investment project modern office.Touching pad contemporary laptop. Worldwide connection technology,stock exchanges graphics interface. Horizontal
Digital Data Visualization with Trend Lines and Percentage Changes
Colorful Bar Graph with Data Overlay on Black Background
Rising Financial Data Graph on Digital Grid Background
Graphical Data Analysis on Digital Interface
Premium
Image of graphs and trading board over low angle view of modern building against cloudy sky. Digital composite, multiple exposure, report, business, stock market, buildings, architecture concept.
Abstract Digital Stock Market Analysis with Graphs
Data Visualization on Digital Grid with Technological Interface
Abstract Financial Data Analysis and Stock Market Trends
Financial Data Analysis on Blue Digital Interface
Premium
Office woman finger touch electronic tablet, stock market changes screen and business bar chart. Double exposure of skyscrapers, pie chart and graphs. Concept of technology and finance
Dynamic Financial Data Overlaid on Grid Background
Abstract Financial Data Processing and Analysis Interface
Innovative Data Analysis over DNA Strand
Fluctuating Stock Market Graph with Dramatic Peaks
Premium
Closeup photo female hands touching screen modern tablet. Account managers working new investment project in office. Using electronic devices. Graphics icons, worldwide stock exchanges interface.
Dynamic Data Dashboard with Multicolored Trendlines and Chart Bars
Displaying Energy Market Analytics with Candlestick Charts, Histograms and Oil Pump Jack
Financial Data Displayed Over City Skyline with Rising Graphs
Financial Data Analysis with Global Digital Interface
Financial Data Visualization with Cityscape Overlay
Futuristic Data Visualization with Financial Statistics
Premium
Business chart with uptrend line graph, bar chart and stock numbers in bull market on white and blue color background (vector)
Digital Finance: Modern Stock Market Analysis Display
Digital Data Visualization with Blue Grid and Timeline
Data Security with Tech Bar Graph Overlay
Economic Slumpflation Display on Digital Graph
Premium
business finance technology and investment concept. Stock Market Investments Funds and Digital Assets. businessman analysing forex trading graph financial data. Business finance background. growth..
Global Finance and COVID-19 Impact Representation
Eco-Friendly Icons Overlaid on Rising Stock Market Graph
Analyzing Financial Graphs with Real-Time Data Trends
Financial Data Analysis with Bar and Line Graph Elements
Premium
Holding hand pressing smartphone against contactless terminal at counter with financial data. Digital transaction, financial data, commerce, payments, technology, business, analytics
Financial Graphs with Social Media Analytics on Digital Chart
Dynamic Financial Data Visualization on Digital Grid Background
Holographic Financial Data Visualization with Stock Trends
Cybersecurity Data Processing with Digital Analytics
Premium
Data analysis Robot trading concept. businessman working with data charts with AI Robot represents use of artificial intelligence in trading investing. Digital transformation technology
Data Analysis Graphics on Digital Grid Background
Financial Data Analysis with Abstract Chart Grid Overlay
Soundwave Visualization and Data Analysis on Digital Grid
Data Visualization on Digital Interface with Graphs and Codes
Premium
Business ideas, currency exchange, and global stock market analysis
Abstract Data Visualization Digital Chart Background
Dynamic Financial Data with Fluctuating Graph Lines
Digital Financial Data Graph on Black Screen Background
Dynamic Analytics Chart with Colored Area Segments and Data Values
Premium
Digital marketing. Businessman holding darts aiming at the target center with icon network connection. Business goal and technology concept, digital marketing, Financial and banking, Digital tech.
Data Terminal Dashboard with Candlestick Charts, Line Plots and Trading Analytics Overlay