
- Home >
- Stock Photos >
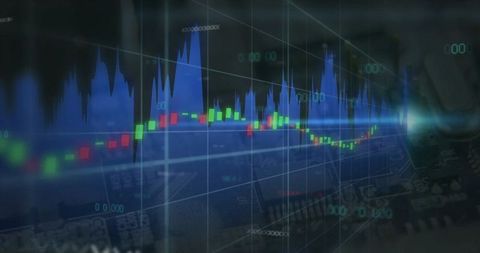
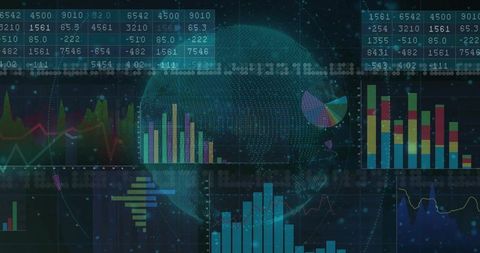
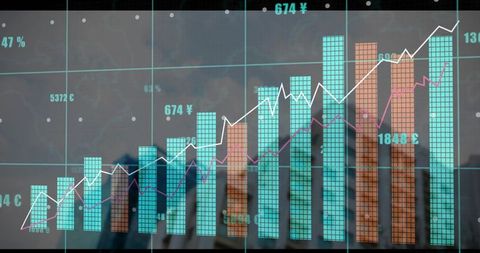
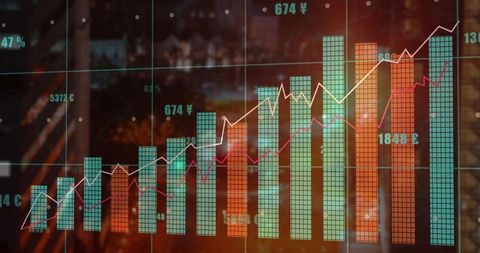
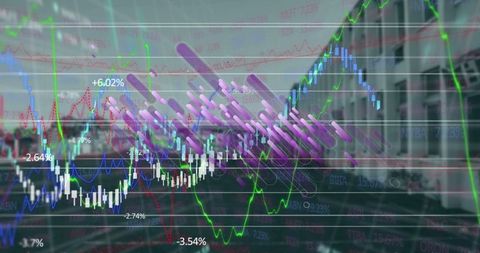
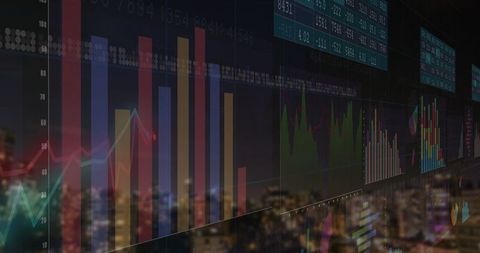
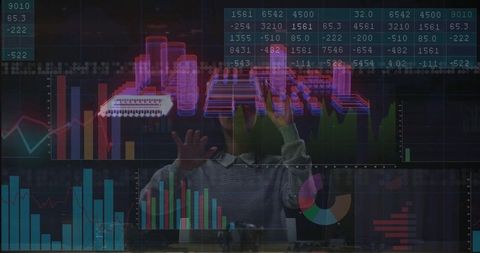
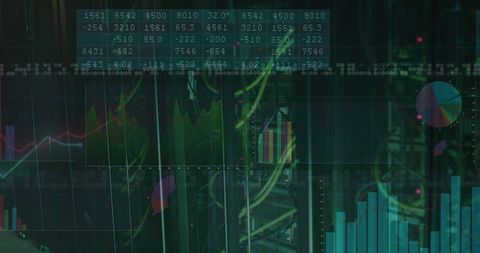
- Financial Data Visualization with Global Connections
Financial Data Visualization with Global Connections Image

Complex digital display of financial charts and data suggesting themes of innovation, trade, commerce, and digital processing. Suitable for use in business presentations, financial blogs, and articles focusing on global economics and stock market trends to illustrate modern data-driven financial decision-making.
Powered by 


downloads
Tags:
More
Credit Photo
If you would like to credit the Photo, here are some ways you can do so
Text Link
photo Link
<span class="text-link">
<span>
<a target="_blank" href=https://pikwizard.com/photo/financial-data-visualization-with-global-connections/b05a1d15e155b36a594f914ea6293a69/>PikWizard</a>
</span>
</span>
<span class="image-link">
<span
style="margin: 0 0 20px 0; display: inline-block; vertical-align: middle; width: 100%;"
>
<a
target="_blank"
href="https://pikwizard.com/photo/financial-data-visualization-with-global-connections/b05a1d15e155b36a594f914ea6293a69/"
style="text-decoration: none; font-size: 10px; margin: 0;"
>
<img src="https://pikwizard.com/pw/medium/b05a1d15e155b36a594f914ea6293a69.jpg" style="margin: 0; width: 100%;" alt="" />
<p style="font-size: 12px; margin: 0;">PikWizard</p>
</a>
</span>
</span>
Free (free of charge)
Free for personal and commercial use.
Author: Creative Art
Similar Free Stock Images

Premium


Premium

Premium


Premium


Premium


Premium


Premium


Premium


Premium


Premium

Premium


Premium

Premium

Premium


Premium


Premium


Premium


Premium


Premium

Premium


Premium


Premium

Premium


Premium

Premium


Explore More Free Stock Images