- Home >
- Stock Photos >
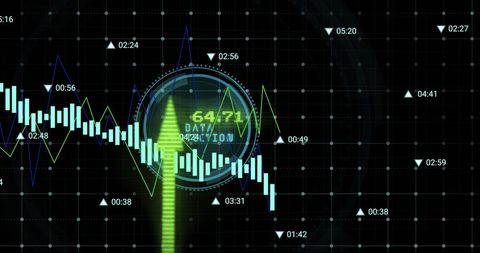
- Financial Data Visualization with Global Network Analytics
Financial Data Visualization with Global Network Analytics Image
Financial charts and graphs overlay create dynamic scene with global network connection vibes, perfect for illustrating concepts in stock trading, finance, or data analysis. Ideal usage includes blog posts, websites, or presentations focused on financial services, market trends, or investing strategies.

downloads
Tags:
More
Credit Photo
If you would like to credit the Photo, here are some ways you can do so
Text Link
photo Link
<span class="text-link">
<span>
<a target="_blank" href=https://pikwizard.com/photo/financial-data-visualization-with-global-network-analytics/09924cdca49907366e83f8e63bc7788c/>PikWizard</a>
</span>
</span>
<span class="image-link">
<span
style="margin: 0 0 20px 0; display: inline-block; vertical-align: middle; width: 100%;"
>
<a
target="_blank"
href="https://pikwizard.com/photo/financial-data-visualization-with-global-network-analytics/09924cdca49907366e83f8e63bc7788c/"
style="text-decoration: none; font-size: 10px; margin: 0;"
>
<img src="https://pikwizard.com/pw/medium/09924cdca49907366e83f8e63bc7788c.jpg" style="margin: 0; width: 100%;" alt="" />
<p style="font-size: 12px; margin: 0;">PikWizard</p>
</a>
</span>
</span>
Free (free of charge)
Free for personal and commercial use.
Author: People Creations