
- Home >
- Stock Photos >
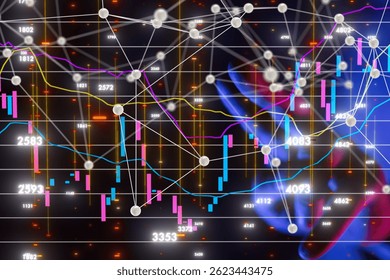
- Financial Data Visualization with Global Network Elements
Financial Data Visualization with Global Network Elements Image

This digital representation showcases financial data combined with global network imagery, symbolizing international finance and connections. The image suggests advanced computing and data analysis techniques, making it suitable for use in articles and presentations related to global business, finance, big data analysis, or technological advancements in data management.
Powered by  - Get 15% off with code: PIKWIZARD15


downloads
Tags:
More
Credit Photo
If you would like to credit the Photo, here are some ways you can do so
Text Link
photo Link
<span class="text-link">
<span>
<a target="_blank" href=https://pikwizard.com/photo/financial-data-visualization-with-global-network-elements/0433b19d979d6e09913752d37d67b308/>PikWizard</a>
</span>
</span>
<span class="image-link">
<span
style="margin: 0 0 20px 0; display: inline-block; vertical-align: middle; width: 100%;"
>
<a
target="_blank"
href="https://pikwizard.com/photo/financial-data-visualization-with-global-network-elements/0433b19d979d6e09913752d37d67b308/"
style="text-decoration: none; font-size: 10px; margin: 0;"
>
<img src="https://pikwizard.com/pw/medium/0433b19d979d6e09913752d37d67b308.jpg" style="margin: 0; width: 100%;" alt="" />
<p style="font-size: 12px; margin: 0;">PikWizard</p>
</a>
</span>
</span>
Free (free of charge)
Free for personal and commercial use.
Author: People Creations
Similar Free Stock Images

Premium


Premium


Premium
Premium


Premium


Premium

Premium


Premium

Premium


Premium


Premium


Premium

Premium


Premium

Premium


Premium

Premium


Premium

Premium


Premium


Premium


Premium

Premium


Premium


Premium

Explore More Free Stock Images