
- Home >
- Stock Photos >
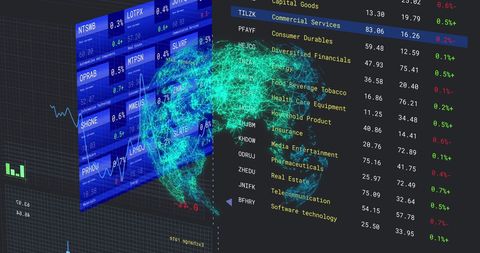
- Financial Data Visualization with Global Network Overlay
Financial Data Visualization with Global Network Overlay Image
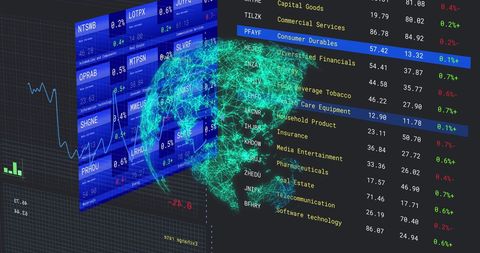
Illustration depicting digital financial data analysis with a global theme, showing interconnected statistics and a network-tied globe. Useful for presentations on finance technology, global business strategies, or data analysis services, highlighting importance of data in decision-making and market analysis.
Powered by 


downloads
Tags:
More
Credit Photo
If you would like to credit the Photo, here are some ways you can do so
Text Link
photo Link
<span class="text-link">
<span>
<a target="_blank" href=https://pikwizard.com/photo/financial-data-visualization-with-global-network-overlay/50e45402b2a7ef51150c98868943d570/>PikWizard</a>
</span>
</span>
<span class="image-link">
<span
style="margin: 0 0 20px 0; display: inline-block; vertical-align: middle; width: 100%;"
>
<a
target="_blank"
href="https://pikwizard.com/photo/financial-data-visualization-with-global-network-overlay/50e45402b2a7ef51150c98868943d570/"
style="text-decoration: none; font-size: 10px; margin: 0;"
>
<img src="https://pikwizard.com/pw/medium/50e45402b2a7ef51150c98868943d570.jpg" style="margin: 0; width: 100%;" alt="" />
<p style="font-size: 12px; margin: 0;">PikWizard</p>
</a>
</span>
</span>
Free (free of charge)
Free for personal and commercial use.
Author: Awesome Content
Similar Free Stock Images

Premium


Premium


Premium


Premium

Premium


Premium


Premium


Premium


Premium


Premium

Premium

Premium


Premium


Premium


Premium


Premium


Premium

Premium


Premium


Premium


Premium

Premium


Premium


Premium


Premium


Explore More Free Stock Images