1. Home > 
  2. Stock Photos > 
  3. Financial Data Visualization with Gold Bullion Background

Financial Data Visualization with Gold Bullion Background Image

Financial Data Visualization with Gold Bullion Background

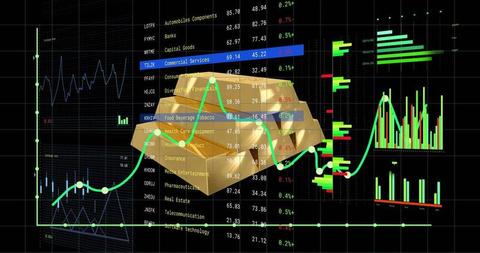
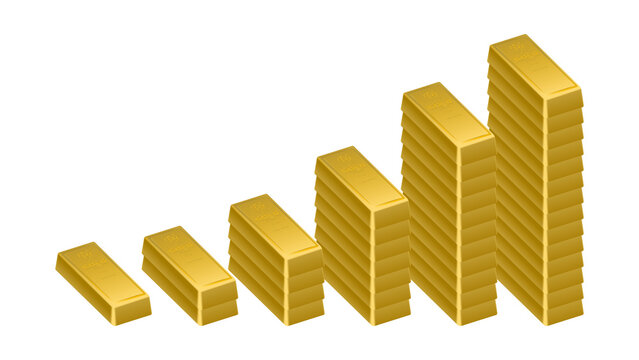
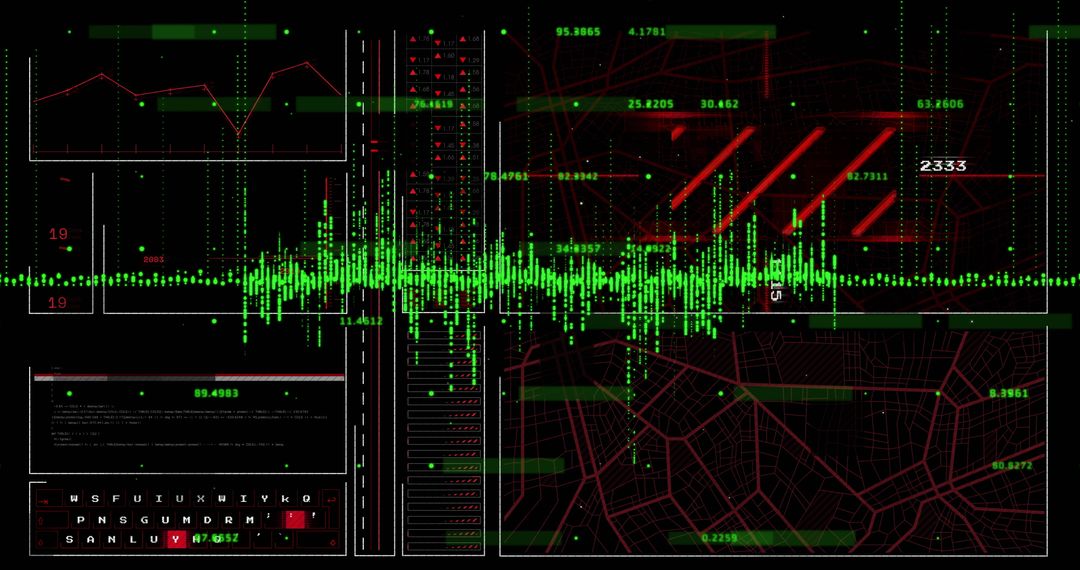
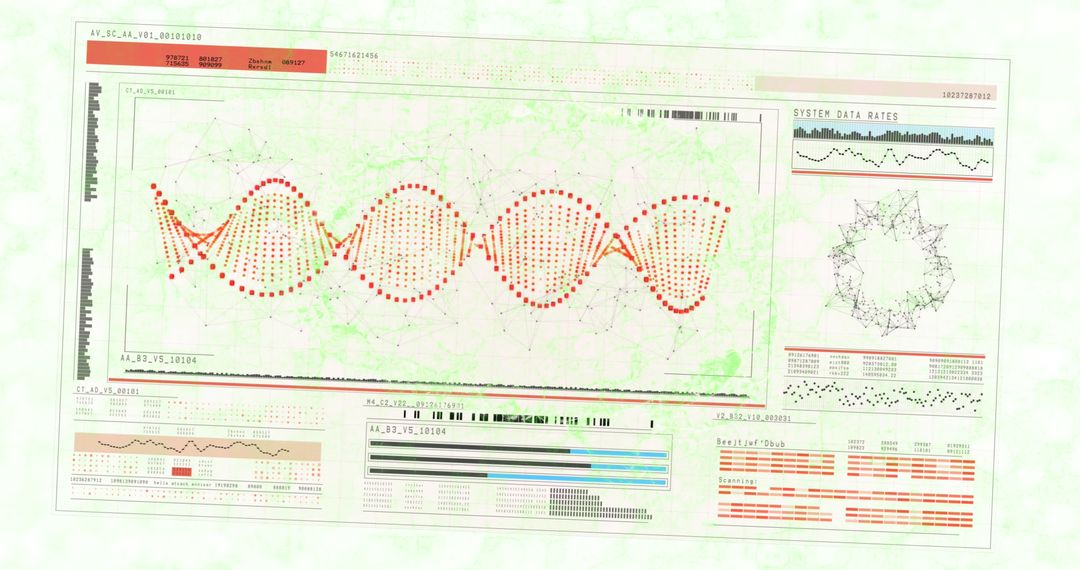
Financial data charts and graphs layered with gold bullion imagery highlight a conceptual blend of investment strategies and gold market trends. Perfect for use in financial blogs, investment platforms, or educational materials about gold investments and data analysis techniques.

Powered by Adobe logo
Robot hand holding gold bar with stock market data representing financial growth - Powered by AdobeDown gold stock market concept with falling red chart over stacked gold bars. Ideal for financial loss, precious metals decline, market crash, and investment risk illustrations. - Powered by AdobeGold Bullion Stack with Stock Market Data Displaying on Monitors Showing Investment Growth - Powered by AdobeGold bullion bars displayed on a financial stock market graph, representing investment growth and profit - Powered by AdobeGold bars and financial market data showing investment trends - Powered by Adobe

Credit Photo

If you would like to credit the Photo, here are some ways you can do so

Free (free of charge)

Free for personal and commercial use.

Author: Creative Art

Similar Free Stock Images

Dynamic Financial Data Display in Digital Space
Premium
Strategic financial planning with gold bullion and a digital tablet showcasing a rising stock market graph, representing robust investment and wealth growth potential in a dynamic economy
Financial Data Streaming with Arrows Over Graphic Indicators
Digital Financial Data Overlaying City Skyline at Dusk
Dynamic Digital Data Analysis on Elevated Grid
Financial Data Flow against Urban Skyline Backdrop
Premium
Gold globe and coins on a white background with a stock market graph, a business financial concept
Data Analytics and Financial Growth Indicators
Digital Finance: Modern Stock Market Analysis Display
Digital Financial Data with Graph and Grid Patterns
Abstract Digital Interface for Medical Data Processing
Premium
Gold bars pyramid on a table, financial chart in the background
Dynamic Financial Charts and Graphs Indicating Market Trends
Financial Data Processing with Digital Patterns for Global Business
Dynamic Financial Growth Digital Chart Display
Digital Financial Data Overlay on Urban Street Scene
Premium
Precious metal investment for wealth and crisis opportunity concept. Gold and silver bars on stock market financial data paper.
Dynamic Forex Trading Graphs with Increasing Numbers
Financial Data Processing with Rising Graphs
Financial Graphs with Social Media Analytics on Digital Chart
Abstract Digital Charts with Social Media Metrics Rising
Premium
A bar graph constructed from stacks of gold bullion bars, presenting a significant increase of asset value. Investment concept isolated on transparent.
Abstract Digital Stock Market Analysis with Graphs
Data Analysis Graphics on Digital Grid Background
NFT Financial Data Visualization with Digital Graph Overlay
Financial Data Analysis and Digital Interface Concept
Premium
Investment in gold bullion showing positive growth with an upward trend arrow on a stock market chart in the background
Dynamic Financial Data Overlaid on Grid Background
Abstract Financial Data Processing and Analysis Interface
Financial Graph with Data Analysis and Market Statistics
Digital Graphs and Data Visualization on Green Background
Digital Finance Data Overlaying Futuristic Cityscape
Digital DNA Strand Visualization on Modern Interface Background
Premium
Gold bar graph with dynamic financial data line. solid metallic investment for finance and economy growth, representing market success
Financial Data Visualization with Cityscape Overlay
Digital Interface with Virtual Data Surging Across Connection Globes
Dynamic Line Chart with Histogram on Digital Grid Background
Rising Digital Graph and Data Visualizations on Black Background
Premium
Investor holding gold bullion bars for wealth management and profit, with a rising financial market graph showing successful returns.
Financial Data Charts in Shimmering Blue Digital Space
Optimized Statistical Data Overlain on Corporate Architecture
Financial Graph Analysis on Green Grid Background
Abstract Digital Graph and Code on Violet Background
Premium
Stack of shining gold bars against a rising financial chart. Physical gold investment and stock market growth trend. Pyramid of precious metal ingots and bullish trade graphs.
Futuristic Financial Data Visualization on Digital Interface
European Market Data Overlay with EU Flag and Financial Graphs
Financial Data Analysis Displayed on Server Infrastructure
Dynamic Financial Data Visualizations on Grid Interface
Premium
Stacked gold bars glint on dark surface, overlaid with glowing financial market graph. Image represents wealth, investment, economic trends with focus on precious metals, market performance analysis.
Abstract Data Visualization with Dynamic Charts and Graphs
Rising Financial Data Graph on Digital Grid Background
Dynamic Data Processing Concept in Digital Interface Design
Digital Data Flow with Infographics Hologram
Premium
Gold Bullion Bars Stacked on Financial Chart Displaying Market Trends and Investment Analysis
Financial Data Analysis Vibrant Graphs on Blue Background
Dynamic Financial Chart with Upward Growth Arrow
Dynamic Financial Graphs Overlaying Modern Cityscape
Futuristic Dashboard Interface with Digital Hologram and Coding Elements
Premium
Gold bars with financial chart background showing market trends
Futuristic Digital Data Analysis Interface Visualization
Dynamic Financial Data Displays Stock Market Trends
Dynamic Graphic of Financial Data Displayed on Graph
Digital Financial Data Interface with Analytics
Financial Data Visualization Over Futuristic Cityscape
Digital Stock Market Trends and Financial Growth Analysis
Premium
gold bullion ingot bar on financial stock market chart background wealth investment trading
Financial Data Graph Rendering Global Market Trends
Falling Line Graph on Navy Background Illustrating Economic Decline
Futuristic Digital Interface with Spiraling Coding Patterns
Digital Rendering Concept of Van with Soundwave and Data Grid Overlay
Premium
Gold Bullion Bars on Financial Chart Background
Dynamic Stock Market Graph Displaying Surging Growth
Dynamic Stock Market Graphs and Financial Data
Digital Financial Data Analysis with Graphs and Stock Market Trends
Financial Graph Displayed Over City Skyline at Sunset
Premium
A stack of gold bullion bars with a glowing green financial chart showing upward growth.
Digital Financial Data Graph Showcasing Market Trends
Financial Data Analysis with Declining Trends
Dynamic Business Data and Cityscape Visualization
Holographic Charts with Social Media Notifications
Premium
Shiny gold bar on financial graph data showing upward trend and economic growth illuminated by golden light
Dynamic Financial Data Visualization on Digital Grid Background
Holographic Financial Data Visualization with Stock Trends
Digital Data Visualization and Analysis Interface
Holographic Financial Stock Market Analysis Visualization
Premium
Golden arrow points up next to stacks of bullion representing growing financial success on stock market with black background
Analyzing Financial Data on Digital World Map Background
Dynamic Financial Graphs Overlaying Urban Skyline
Global Financial Data Analysis with Colorful Graphs
Abstract Data Network with Financial Analytics Overlay
Premium
Pile of gold bars with upward trending financial stock market graph and yellow line chart bullion finance
Dynamic Stock Market Chart with Fluctuating Trends and Data Points
Digital Financial Data Graph on Black Screen Background
Financial Data Displayed Over City Skyline with Rising Graphs
Futuristic Digital Interface with DNA and Brain Diagrams
Financial Data Overlay on Cityscape Visualizing Market Trends
Dynamic Financial Graphs Over Cityscape Background
Premium
Stacks of gold bars with an upward trending stock market graph in the background, representing investment and financial growth
Dynamic Green Stock Chart on Digital Grid Background
Digital Graph Interface with Glowing Data and Readings
Digital Data Analytics Overlay on Cityscape
Digital Financial Dashboard with Graphs and Data Visualization
Premium
Stunning gold bars gleaming with financial success against a backdrop of rising stock market trends, symbolizing wealth and prosperity
Dynamic Data Graphs on Digital Interface Background
Data Trends and Analysis on 3D Digital Grid
Social Media Activity Icons on Digital Graph
Digital Financial Data Analysis with Infographics and Charts
Premium
Gold Bullion on Digital Financial Chart Background.
Data Analytics Graphs on Digital Interface Background
Financial Graphs Overlaying Shopping Bag Representation Economy
Digital Data Visualization with Trend Lines and Percentage Changes
Colorful Bar Graph with Data Overlay on Black Background
Premium
Elegant gold bars with stock chart reflect wealth, investment, and global finance
Data Visualization on Security Shield Interface for Cyber Security
Digital Chart Display Financial Data Analysis Background Effects
Digital Cityscape with Financial Data Overlay
Digital Data and Financial Charts on White Background
Premium
Close-up of gold bars on a trading desk, with a blurred stock market chart in the background, symbolizing financial stability and market volatility.
Cityscape with Digital Stock Market Graphs and Statistics
Dynamic Financial Data on Digital Screen
Digital Financial Data Analysis on Grid Framework
Abstract Representation of Financial Data Processing
Premium
Gold bars (ingots) on a trading table with a rising stock market chart graph in the background. Financial business concept of investment, wealth, and success
Digital Interface Visualizing DNA and Data Patterns