- Home >
- Stock Photos >
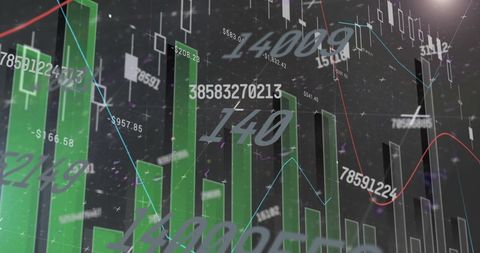
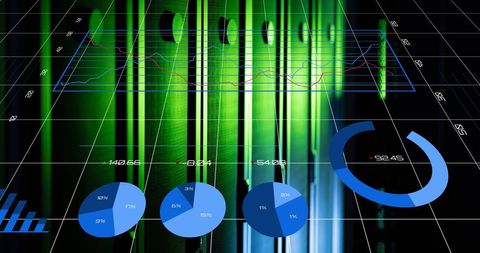
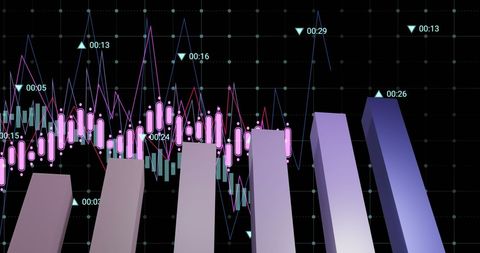
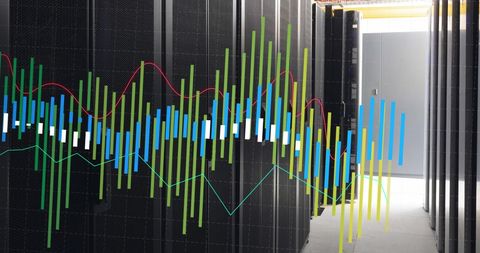
- Financial Data Visualization with Graphs and Analysis
Financial Data Visualization with Graphs and Analysis Image

Provides a dynamic representation of financial data, ideal for illustrating concepts in investment analysis, digital finance, presentations, and reports focusing on global business trends. Useful for educational content, financial news, economic forecasts, and market analysis software.

downloads
Tags:
More
Credit Photo
If you would like to credit the Photo, here are some ways you can do so
Text Link
photo Link
<span class="text-link">
<span>
<a target="_blank" href=https://pikwizard.com/photo/financial-data-visualization-with-graphs-and-analysis/4f0fdde1b8f02aa07b819ca297fd5b72/>PikWizard</a>
</span>
</span>
<span class="image-link">
<span
style="margin: 0 0 20px 0; display: inline-block; vertical-align: middle; width: 100%;"
>
<a
target="_blank"
href="https://pikwizard.com/photo/financial-data-visualization-with-graphs-and-analysis/4f0fdde1b8f02aa07b819ca297fd5b72/"
style="text-decoration: none; font-size: 10px; margin: 0;"
>
<img src="https://pikwizard.com/pw/medium/4f0fdde1b8f02aa07b819ca297fd5b72.jpg" style="margin: 0; width: 100%;" alt="" />
<p style="font-size: 12px; margin: 0;">PikWizard</p>
</a>
</span>
</span>
Free (free of charge)
Free for personal and commercial use.
Author: Authentic Images