1. Home > 
  2. Stock Photos > 
  3. Financial Data Visualization with Graphs and Charts

Financial Data Visualization with Graphs and Charts Image

Financial Data Visualization with Graphs and Charts

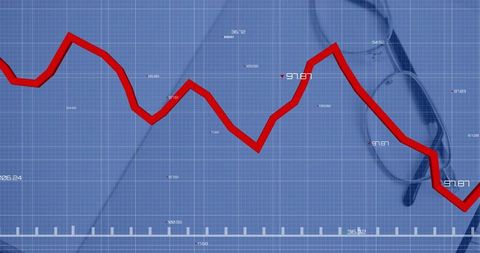
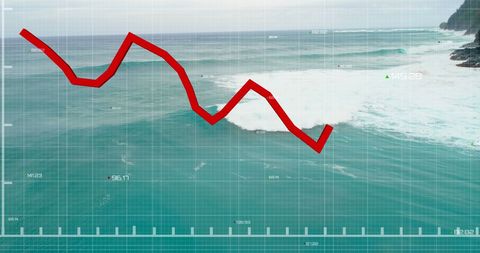
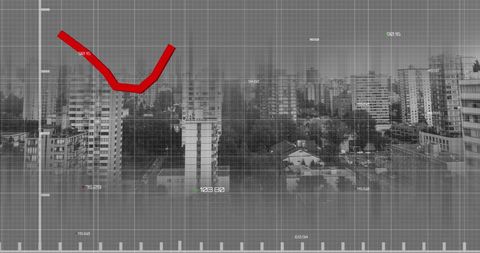
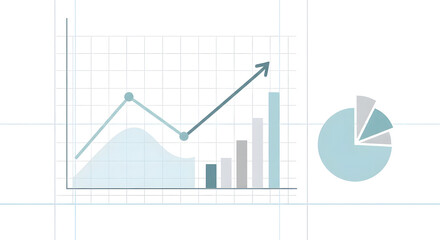
The image shows a red line graph intersecting with a semi-transparent pie chart against a backdrop of financial data. This illustration is ideal for presentations, articles, and digital content related to business analytics, financial markets, or econometric studies. It represents concepts like financial health, market analysis, or trend forecasting.

Powered by Shutterstock logo - Get 15% off with code: PIKWIZARD15
Visualizing central data analytics on digital interface, with pie charts bar graphs formulas. Futuristic, technology, visualization, infographics, digital, scientific, analytical - Powered by Shutterstock - Get 15% off with code: PIKWIZARD15Superimposing charts over winding river in forest valley with pie charts, line graphs and world map. Nature, landscape, ecology, data visualization, analytics, environment, technology - Powered by Shutterstock - Get 15% off with code: PIKWIZARD15Displaying data overlay over urban facades, showing pie charts, bar charts, line graph, world map. Futuristic, analytic, corporate, sleek, modernization, technology, data-driven - Powered by Shutterstock - Get 15% off with code: PIKWIZARD15Featuring blue ring chart pulsing in virtual dashboard over 3D grid, with bar charts, line graphs. Data visualization, analytics, digital interface, futuristic, financial data, infographic, interface - Powered by Shutterstock - Get 15% off with code: PIKWIZARD15Rising orange line graph hovering at lakeside dawn, with blue bars, pie chart, numeric labels, grid. Scenic, tranquil, data visualization, analytics, financial, digital art, sunrise - Powered by Shutterstock - Get 15% off with code: PIKWIZARD15

Credit Photo

If you would like to credit the Photo, here are some ways you can do so

Free (free of charge)

Free for personal and commercial use.

Author: Creative Art

Similar Free Stock Images

Rising Green Line on Financial Digital Display
Premium
Data visualization running in virtual dashboard, with pie charts line charts and percentage labels. Analytics, infographics, digital interface, dashboard, business intelligence, corporate, screen
Futuristic Data Graph Overlay on Urban Cityscape
3D Pie and Line Charts Illustrating Financial Trends
Interactive Financial Graph on Virtual Office Background
Pie Graph and Red Line Graph with Financial Data
Premium
Overlaying pie chart over dense urban skyline at aerial view, with bar chart and line graphs. Metropolitan, data visualization, financial analysis, graphical overlay, urban planning, analytics,
Financial Data and Moonlit Cityscape Fusing Global Business Insights
Financial Data Processing Graphic with Rising Stock Arrow
Financial Graphs Overlaying Business Collaboration in Office
Conceptual Line Graphs Highlighting Economic Decline over Pollution
Premium
Displaying translucent pie charts over open sea, with world map bar and line graph percentages. Data visualization, financial analysis, ecosystem, technology, marine, infographic, global
Rising Financial Trends with Virus Background in Digital Interface
Dynamic Financial Infographic with Moving Green Graph Line
Digital Display of Financial Decline Graph and Data Connectivity
Rising Data Graph with Changing Numbers on Blue Grid
Premium
A visually appealing image featuring multiple graphs and charts rising upward, symbolizing economic growth. The image includes elements such as bar charts, line graphs, and pie charts
Descending Red Line on Beach Background Illustrates Financial Decline
Biometric Analysis with Financial Data Overlay
Rising Line Graph and Digital Data on Modern Interface
Financial Data Visualization Global Market Trends
Premium
Many screen monitors with charts and graphs
Financial Chart Overlay on Modern Office Background
Dynamic Financial Data Chart with Red Trend Line on Green Background
Red up and down financial graph on grey digital background
Digital Data Display in Modern Office on Virtual Grid
Premium
Showing financial bar, line and pie charts with scrolling numeric tickers over blurred city skyline. Abstract, data visualization, analytics, technology, investment, digital, modern
Financial Graph on Globe with Digital Grid Background
Abstract Technology Background with Red Graph Line Chart Plummeting
Businesswoman with Suitcase Walking Viewed Through Financial Analytics
Rising Trend in Financial Analysis Overlaid on Laptop Silhouette
Dynamic Graph Lines Over Digital Grid Background
Red Graph Line Overlaying Cityscape Represents Market Trends
Premium
Visualizing central vertical bar chart data at screen, with line graphs and pie charts. Analytics, data, visualization, digital, finance, technology, corporate
Digital Financial Data with Pie Chart and Line Graph Display
Dynamic Financial Analysis with Pie and Line Graphs
Financial Data Visualization with Graph and Pie Chart
Businesswoman Analyzing Digital Data Interfaces
Premium
Grid overlay floating over high-rise skyline and roadway, showing line graph, bar and pie charts. Cityscape, data visualization, skyline, urban, analytics, futuristic, technology
Financial Data Analysis with Digital Pound Projection
Green Line Graph Overlaying Modern Office Setting
Dynamic Red Line Graph on Dark Background Depicting Financial Crisis
Futuristic Digital Fingerprint Scan on High-Tech Grid Interface
Premium
Showing dashboard plotting line and bar charts on blue grid, with world map and numeric overlays. Analytics, visualization, data, technology, finance, dashboards, growth
Colorful Graphs Indicating Financial Data Analysis Over Grid Background
Declining Global Economy with Red Line Graph
Declining Financial Chart with Red Lines on Data Grid
Green Line Graph on Blue Digital Office Background
Premium
Displaying downward-trending orange-red line graph overlaying urban street with cars, pie charts. Financial data, urban landscape, transportation, analytics, charts, cityscape, investment
Financial Data Graph with Rising Green Line and Analytics Dashboard
Financial Data Processing and Analysis with Digital Interface
Digital Icons and Data Trends in Server Room Environment
Global Financial Downturn Over Map with Red Graph Line
Premium
Displaying wind turbine in fields with colored line charts, bar and pie charts, numeric tickers. Renewable, sustainability, financial, digital, technology, ecology, investment
Dynamic Financial Data Graph Visualization on Black Background
Blue Graph Lines on Data Grid Background Indicate Financial Trends
Red Line Graph Showing Financial Decline on Grid Background
Financial Data Graph Overlaying Cityscape Illustration
Premium
Displaying field featuring chart and map overlays of candlestick, line and pie charts. Landscape, data visualization, financial analysis, agribusiness, rural, technology, analytics
Global Financial Trends Data Analysis Over Warehouse Background
Red Line Graph on Futuristic Data Display
Waveform Graph with Red Line Over Grid and Eyeglasses Symbolizing Analytics
Falling Market Graph Overlaid on Euro Banknotes and Burning Sparks
Financial Market Analysis Overlaying Urban Cityscape
Global Data Analysis and Financial Trends Visualization
Premium
Displaying data overlay with vertical beams on tower, showing bar charts line graphs and tickers. Futuristic, architecture, data, analytics, digital, financial, technology
Abstract Financial Graphs with Pie Chart over Data Grid
Abstract Graphs Overlapping Financial Data Analysis
Data Decline Concept with Graph Over Ocean
Dynamic Financial Data Visualization Chart with Trending Lines
Premium
Displaying large circular pie chart overlaying calm lakeside water, with world map and line graph. Analytics, data visualization, infographics, business intelligence, financial charts, digital
Dynamic Line Graph on Business Office Background Depicting Growth
Dramatic Red Line Graph on Dark Grid Background
Data Trends Visualization Over Virus Background
Business Data Trends with COVID-19 Cell Background
Premium
Featuring pylon silhouette against dusk hills showing candlesticks line graphs with data, pie chart. Technology, energy, infrastructure, data visualization, digital, innovation, finance
Fluctuating Line Graph Over Abandoned Factory Scene
Falling Statistics with Red Graph on Digital Interface
Dynamic Financial Growth Chart in Modern Office
Global Business Growth with Digital Interface
Premium
Financial charts overlaying dusk city skyline, with gridlines bar line pie charts labels. Digital, data, visualization, innovation, technology, analytics, urban
Abstract Financial Graph with Upward Trend Line
Red Line Graph Overlay on Cityscape Represents Economic Trends
Green Financial Data Chart with Technological Overlay
Financial Graph Overlaid on Seascape Symbolizing Market Analysis
Premium
Abstract dashboard showing on screen, with red line graph bar chart pie slices and numeric overlays. Data visualization, analytics, technology, interface, financial, progress, business intelligence
Falling Spike Pattern in Digital Heart Icon Graph
Dynamic Green Line Graph Overlaying Abstract Grid Background
Stock Market Trends with Upward and Downward Graph
Digital Data Processing with Rising Global Trend Line on Earth
Premium
Displaying neon data streams moving across dashboard, with pie charts and world map overlay. Futuristic, digital, visualization, analytics, interface, high-tech, financial
Economic Downturn Concept on Trading Dashboard with Data Visualization
Displaying Radar Grid with Red Jagged Trend Line on Futuristic HUD Analytics Interface
Cityscape with Digital Financial Data Overlay Inspiration for Global Business
Ukraine Crisis Economic Downturn Illustrated by Financial Graph
Digital Network Showing Global Data Trends and Analysis
Dynamic Financial Chart with Graph Overlay
Premium
Overlaying green financial data on sunlit sea featuring line graph candlestick percentage pie chart. Marine, analytics, modern, finance, visualization, outdoor, digital
Interactive Financial Graph with Economics Concept
Financial Data Processing Overlaid on Urban Cityscape
Economic Crisis Graph Over Ukraine Flag Illustrating Financial Downturn
Financial Data Visualization with Declining Red Line Graph
Premium
Showing data overlay over valley fields, with candlestick bars, line graphs, pie chart and tickers. Landscape, data visualization, analytics, rural, technology, charts, nature
Server Room Data Analytics with Declining Graph Representation
Economic Downturn During Health Crisis Visualization
Dynamic Graph Analysis over Covid-19 Virus Cells
Financial Data Visualization with Green Graph Line on Blue Background
Premium
Tapping mature woman's hands using smartphone in workspace with HUD and pie chart overlay. Holographic, interface, visualization, data, analytics, graph, hand
Graph Visualizing Economic Downtrend and Financial Data
Global Financial Market Trends Overlaid on Digital World Map
Global Success: Digital Globe and Rising Graph Lines
Dynamic Financial Data and Analytics with Euro Symbol
Premium
Displaying snowy suburb from aerial view, overlaying translucent bar graphs, pie chart, data grids. Urban, residential, winter, aerial, infographic, data visualization, analysis
Abstract Blue Graphical Financial Analysis on Grid Background
Financial Data Projection in Modern Office Surroundings
Financial Data Visualization Over Ocean Scenery
Digital Stock Market Data on Red Background
Premium
Displaying line graphs, bar charts, pie segments, tickers and tables over city skyline. Financial analytics, data visualization, urban environment, modern design, business intelligence, digital
Digital Interface with Declining Graph Overlay in Office Environment
Dynamic Financial Market Graph with Data Points
Dynamic Green Business Data Graph with Office Backdrop
Earth with Downward Trending Graph Indicating Global Financial Crisis
Premium
Overlaying steel transmission towers spanning field at sunrise, with financial charts and pie chart. Infrastructure, energy, technology, landscape, analytics, data visualization, rural
Translucent DNA Helix Intersecting Declining Red Line Graph Representing Biotech Downturn