1. Home > 
  2. Stock Photos > 
  3. Financial Data Visualization with Graphs and Global Map

Financial Data Visualization with Graphs and Global Map Image

Financial Data Visualization with Graphs and Global Map

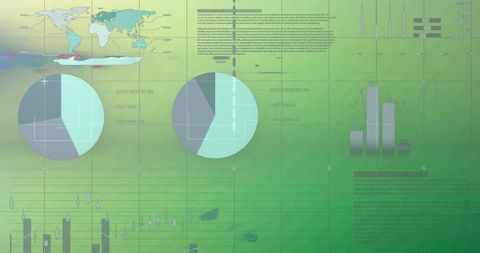
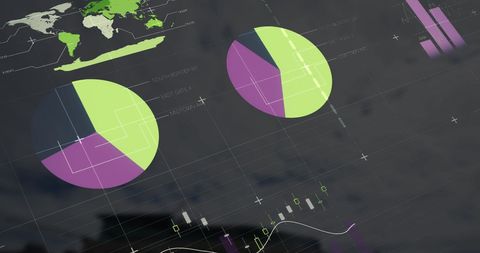
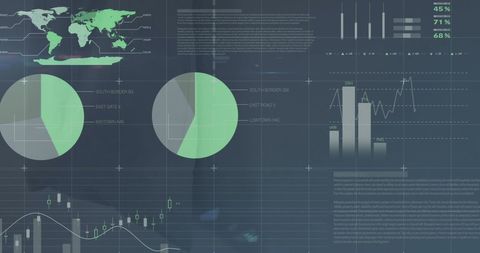
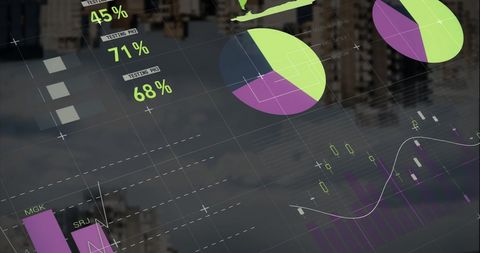
Graphical representation of financial data includes pie charts and global map in digital interface. Useful for illustrating global business analytics, stock market analysis, corporate presentations and reports analyzing financial trends.

Powered by Adobe logo
Business professionals collaborating and analyzing financial data on a laptop with charts and graphs during a meeting - Powered by AdobeAnalyzing business data charts and graphs for financial performance and marketing strategy - Powered by AdobeA business professional engages with a tablet, analyzing financial data presented through interactive charts and graphs, enhancing strategic insights for decision making. Scalp - Powered by Adobe
Dynamic blue and green digital stock market graph with bar charts and lines on a dark background, representing financial data analysis, investment trends, business growth, and global economy fluctuat - Powered by AdobeA professional analyzing financial data using a digital tablet with dynamic charts and graphs. - Powered by Adobe

Credit Photo

If you would like to credit the Photo, here are some ways you can do so

Free (free of charge)

Free for personal and commercial use.

Author: Awesome Content

Similar Free Stock Images

Digital Financial Charts and Data Visualization 4K
Premium
Ai generated image of laptop displaying financial data analysis charts and graphs isolated on transparent background
Global Data Analysis and Visualization Interface
Premium
Magnifying glass over financial charts and graphs showing data analysis and growth
Premium
Data Examination: A magnifying glass hovers over financial reports and charts on a sky-blue surface, providing an overview of the business analysis.
Digital Interface with Financial Charts and Analytics
Digital Interface and Data Processing in Modern Server Room
Global Business Infographic with Digital Map Interface
Global Data Visualization with Charts and World Map Elements
Premium
Business people collaborating in an office, analyzing financial charts and graphs with pens in hand. Utilizing calculators, tablets, and notebooks to strategize and plan for growth
Heart Icons Overlayed on Global Data Processing Interface
Abstract Infographic Interface with Mathematical Equations Overlay
Digital Financial Data Analysis and Graphical Mindset
Abstract Digital Security Interface with Social Network Icons
Premium
Transparent or png stock market investment trading graph growth.Trade business analytics graph and financial chart.
Digital Financial Data and Global Analytics Interface
Digital Dashboard with Global Data Visualization Elements
Global Financial Data Chart and Graph Analysis Background
Digital Data Processing and Statistics Visualization
Premium
Business meeting with financial charts and graphs on screen, pen on document with colorful data analysis in foreground, blurred office background.
Futuristic Data Processing Interface on Digital Grid Background
Complex Financial Data Visualizations Over Dark Background
Global Finance Data Concepts Over Urban Landscape
Digital Graphs and Equations on Black Background for Business and Education
Premium
Manager touches growth graph on analytics dashboard. Business data analysis reports with marketing finance management strategy. Digital charts graphs increase business performance, sales statistic
Global Data Analysis with Pie Charts and Financial Graphs
Abstract Digital Interface with Charts and Graphs Overlay
Digital Social Media Engagement and Data Analytics Concept
Abstract Business Data Analytics and Statistics Visualization
Digital Data Visualization Over City Lights Background
Digital Data Analytics and Global Networking Concept
Global Finance Data Visualization Over Urban Cityscape
Abstract Financial Data with Charts and Maps Overlay
Infographic Interface Display over Cityscape at Dawn
Dynamic Financial Infographic with Moving Green Graph Line
Global Financial Data Analytics and Economic Graphs
Abstract Financial Report Data with Graphs and World Map
Premium
Many charts and graphs. Reflection light and flare. Concept image of data gathering. various business charts and graphs printed on a bright white paper. The documents feature blue bar graphs
Financial Data Processing with Digital Analytics Overlay
Digital Interface with Mathematical Equations and Pie Charts
Data Visualization with Financial Graphics on Abstract Background
Global Financial Data Visualizations with Charts and World Map
Dynamic Financial Graph and Data Visualization Concept
Colorful Pie Charts and Graphs for Digital Data Analysis Presentation
Futuristic Analytics Dashboard Interface with Charts
Data Analysis Dashboard Overlaid on Night City Traffic Background
Displaying Cybersecurity Dashboard with Global Map, Donut Chart, Candlestick and Tabular Data
Premium
Data Analyst Using Data Analytics KPI
Dynamic Financial Data Analytics with Global Connections
Futuristic Data Analysis Interface with Holographic Displays
Digital Patterns of Data Analytics with World Map Overlay
Digital Analytics Dashboard with Pinpoint Maps and Graphs
Premium
Business growth analysis charts and graphs financial data report with laptop stock
Digital Data Analysis and Visualization Over Modern Cityscape
Futuristic Digital Dashboard with Business Analytics
Global Financial Data Visualization with Statistics and Charts
Digital Data Analysis Over Modern Cityscape
Premium
Magnifying glass focusing on candlestick chart, showcasing market analysis on a dark background, concept for financial review, investment strategy and business intelligence data analysis
Visualizing futuristic neon data dashboard with global analytics, pie charts, candlesticks
Futuristic Data Analytics Visualization with Global Interface
Digital Financial Data Analytics with Pie Charts and Graphs
Premium
Business hands discussing financial data and graphs on a wooden meeting table
Premium
A newspaper with financial charts and a cup of coffee sits on a wooden table.
Digital Analytics and Global Financial Data Visualization
Digital Data and Financial Charts on Dark Interface
Premium
Businessman working late analyzing financial data stock market charts in modern office setting
Digital Data Processing with Graphs and Maps Interface
High-Tech Financial Data Visualization Over Desktop
Futuristic Digital Interface with Financial Data Graphs
Financial Data Interface in Modern Office Environment
Premium
Stacked financial reports with graphs and charts analysis business
Premium
Analyzing financial charts and data reports in modern office setting
Digital Infographic Overlay with Construction Theme
Global Finance and Data Visualization Concept
Global Data Analysis and Financial Statistics Monitoring
Futuristic Digital Charts and Data Visualization with Global Map
Premium
Financial market data analysis with glowing 3D bar and line charts on dark background showing economic trends and growth concept visualization. 3D Rendering
Global Data Processing Interface with Graphs and Charts
Comprehensive Financial Data Analytics Interface with Global Indicators
Digital Interface Display in Modern Office Environment
Digital Display of Global Financial Data Processing
Premium
Analyzing financial data on a smartphone, with charts and graphs in the background
Futuristic Digital Screen with Global Financial Data Visualization
Global Business Data Visualization Overlay on Professionals
Futuristic Digital Interface with Graphs and Charts in Blue Tones
Premium
A business professional engages with financial data on a laptop, surrounded by innovative graphs and charts that signify growth and success in a corporate environment. Scalp
Global Data Visualization with Interactive Graphs and Charts on Dark Interface
Email Notifications Over Financial Data Charts and Graphs
Abstract Overlay of Financial Charts and Statistics
Digital Infographics over Cityscape Analyzing Business Growth and Progress
Premium
Analyzing real-time financial market trends and stock performance with vibrant candlestick charts and data displayed on a digital screen, symbolizing investment analysis and global economic activity
Infographic Interface Featuring Digital Tree and Financial Data Visualization
Financial Data with Pie and Bar Graphs on Dark Digital Background
Dynamic Statistical Data Processing Interface
Futuristic Data Visualization with Pie Charts and World Map
Futuristic Data Visualization with Mathematical Equations and Graphs
Multicolored Infographic Interface Over Cityscape
Financial Data and Analytics Visualization in Digital Interface
Global Financial Data Processing Visualization in Grid Format
Innovative Global Business Data Interface Concept
Data Analytics with Global Financial Charts on Dark Background
Abstract Digital Dashboard with Data Visualizations
Digital Interface with Global Data Analytics Concepts
Futuristic Data Visualization with Charts and Graphs on Black Background
Abstract Financial Analytics Interface with World Map and Data Charts
Premium
Business team is analyzing financial documents, pointing at charts and graphs, discussing strategies and collaborating on a project during a corporate meeting.
Premium
A confident businessman presents financial data to a diverse team during a corporate meeting.
Digital Dashboard with Social Media Analytics on Screen
Digital Data Visualization of Global Statistics and Trends
Data Analytics Dashboard with Charts, World Map, and Metrics
Colorful Financial Data Processing on Digital Screen
Premium
The office desk with charts graphs and a laptop  long title A close up view of an organized office desk featuring a laptop financial charts and data
Innovative Digital Analytics Interface with Global Data Visualization
Digital Data Analysis Overlay with Urban Environment
Digital Financial Data Analytics with Global Insights
Infographic of Global Business Statistics Over Modern Building
Digital Interface with Mathematical Equations and Data
Premium
Business intelligence analyst dashboard on virtual screen. Big data Graphs Charts.
Interconnected Global Network and Data Visualization
Global Financial Data Analysis with Interactive Charts
Abstract Global Data Analytics Interface with Cityscape Background
Data Analytics with World Map and Stock Market Graph Icons
Premium
Business charts graphs analysis with calculator and magnifying glass
Financial Analytics Over Cityscape with Graphs and Charts
Digital Screen Displaying Business Analytics and Data Visualization
Explore More Free Stock Images