
- Home >
- Stock Photos >
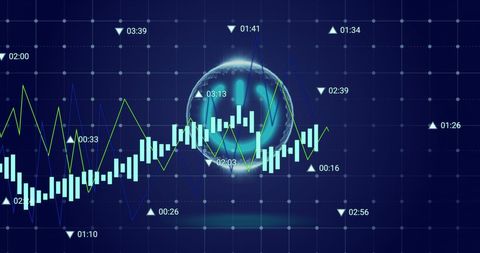
- Financial Data Visualization with Graphs and Numeric Trends
Financial Data Visualization with Graphs and Numeric Trends Image
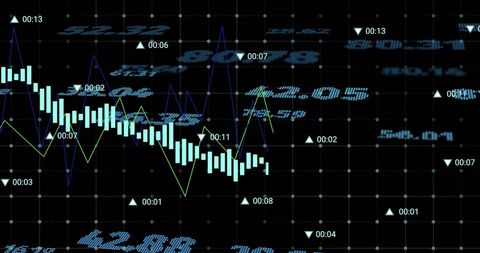
This image displays a dynamic digital visualization of financial data, featuring various graphs and numeric trends against a black background. It symbolizes the complex nature of global stock markets and real-time data analysis. Ideal for use in financial apps, business presentations, website headers, or articles related to investment and economic trends.
Powered by 


downloads
Tags:
More
Credit Photo
If you would like to credit the Photo, here are some ways you can do so
Text Link
photo Link
<span class="text-link">
<span>
<a target="_blank" href=https://pikwizard.com/photo/financial-data-visualization-with-graphs-and-numeric-trends/b91e9efea6843b9e91492a0d022072b5/>PikWizard</a>
</span>
</span>
<span class="image-link">
<span
style="margin: 0 0 20px 0; display: inline-block; vertical-align: middle; width: 100%;"
>
<a
target="_blank"
href="https://pikwizard.com/photo/financial-data-visualization-with-graphs-and-numeric-trends/b91e9efea6843b9e91492a0d022072b5/"
style="text-decoration: none; font-size: 10px; margin: 0;"
>
<img src="https://pikwizard.com/pw/medium/b91e9efea6843b9e91492a0d022072b5.jpg" style="margin: 0; width: 100%;" alt="" />
<p style="font-size: 12px; margin: 0;">PikWizard</p>
</a>
</span>
</span>
Free (free of charge)
Free for personal and commercial use.
Author: Awesome Content
Similar Free Stock Images

Premium


Premium


Premium


Premium


Premium


Premium


Premium


Premium


Premium


Premium


Premium

Premium


Premium


Premium


Premium


Premium


Premium


Premium


Premium


Premium


Premium

Premium


Premium


Premium


Premium

Explore More Free Stock Images