
- Home >
- Stock Photos >
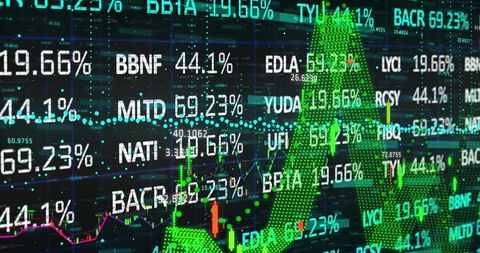
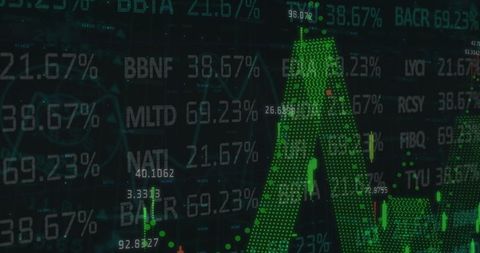
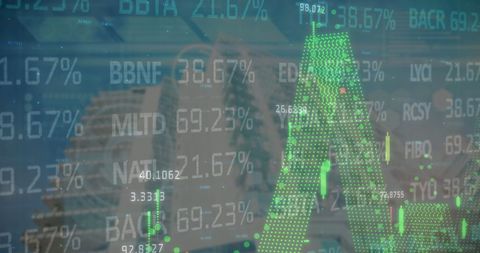
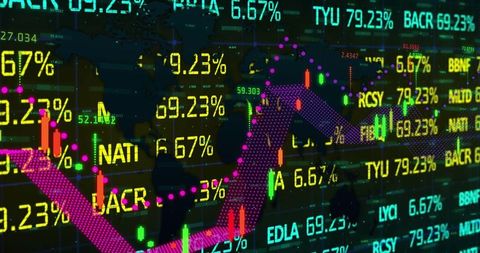
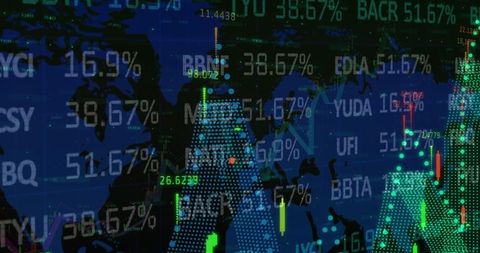
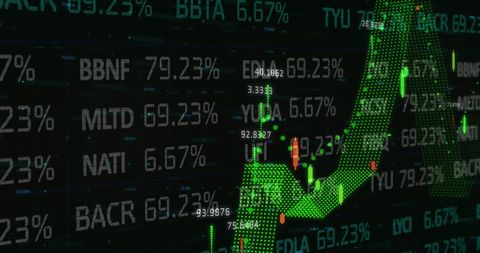
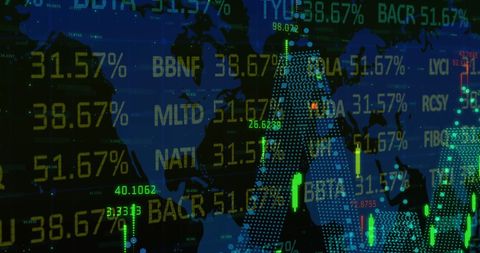
- Financial Data Visualization with Green Graph and Numbers
Financial Data Visualization with Green Graph and Numbers Image

Digitally generated concept showing financial data processing through flashing numbers and a green graph. Useful for illustrating stock market analysis, digital finance tools, and economic trends. Ideal for business presentations, economic reports, or as illustrative material in educational content relating to financial literacy.
Powered by  - Get 15% off with code: PIKWIZARD15


downloads
Tags:
More
Credit Photo
If you would like to credit the Photo, here are some ways you can do so
Text Link
photo Link
<span class="text-link">
<span>
<a target="_blank" href=https://pikwizard.com/photo/financial-data-visualization-with-green-graph-and-numbers/43079299c0dcf5f127d7a2d6fc20b929/>PikWizard</a>
</span>
</span>
<span class="image-link">
<span
style="margin: 0 0 20px 0; display: inline-block; vertical-align: middle; width: 100%;"
>
<a
target="_blank"
href="https://pikwizard.com/photo/financial-data-visualization-with-green-graph-and-numbers/43079299c0dcf5f127d7a2d6fc20b929/"
style="text-decoration: none; font-size: 10px; margin: 0;"
>
<img src="https://pikwizard.com/pw/medium/43079299c0dcf5f127d7a2d6fc20b929.jpg" style="margin: 0; width: 100%;" alt="" />
<p style="font-size: 12px; margin: 0;">PikWizard</p>
</a>
</span>
</span>
Free (free of charge)
Free for personal and commercial use.
Author: Awesome Content
Similar Free Stock Images

Premium


Premium


Premium

Premium


Premium


Premium

Premium


Premium


Premium


Premium

Premium


Premium

Premium

Premium


Premium


Premium


Premium


Premium

Premium


Premium

Premium


Premium


Premium

Premium


Premium


Explore More Free Stock Images