1. Home > 
  2. Stock Photos > 
  3. Financial Data Visualization with Green Graph Line on Blue Background

Financial Data Visualization with Green Graph Line on Blue Background Image

Financial Data Visualization with Green Graph Line on Blue Background

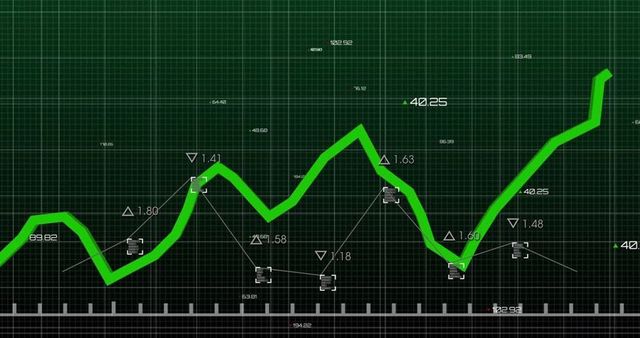
Concept of financial data processes displayed with a green line on a blue digital background conveys ideas such as global business influence, economic trends, and technology in financial sectors. Suitable for illustrating themes like stock market analytics, digital economy strategies, or forward-looking financial presentations.

Powered by Shutterstock logo - Get 15% off with code: PIKWIZARD15
Showing green orange red data lines fluctuating on interface, with numeric labels white axis ticks. Futuristic, analytical, vibrant, technology, dashboard, data visualization, digital interface - Powered by Shutterstock - Get 15% off with code: PIKWIZARD15Displaying digital interface overlaying corporate corridor, with line graph, tickers and dashboards. Technology, analytics, innovation, business, data visualization, finance, modern - Powered by Shutterstock - Get 15% off with code: PIKWIZARD15Displaying digital financial data table filling screen at trading desk, with overlaid trend graph. Analytics, technology, dashboard, finance, investment, graphic, interface - Powered by Shutterstock - Get 15% off with code: PIKWIZARD15Displaying green line graph trending on screen with yellow and teal lines, grid overlay, labels. Data analytics, financial analysis, technology, infographic, business intelligence, digital interface, - Powered by Shutterstock - Get 15% off with code: PIKWIZARD15Financial analysis with digital stock data interface - Powered by Shutterstock - Get 15% off with code: PIKWIZARD15

Credit Photo

If you would like to credit the Photo, here are some ways you can do so

Free (free of charge)

Free for personal and commercial use.

Author: Creative Art

Similar Free Stock Images

Stock Market Trends with Upward and Downward Graph
Premium
Displaying digital chart on trading desk, with candlestick bars, trend lines and numeric data. Finance, technology, analytics, data visualization, investment, stock market, dashboard
Green Analytics Line Graph on Dark Grid Background
Premium
Displaying trading platform interface showing candlestick bars and line graph, with grid and labels. Finance, investment, analytics, data visualization, technology, digital, business
Dynamic Financial Data Graph with Global Grid Background
Green Line Graph Rising on Gradient Background Shows Financial Growth
Glowing neon line graph streaming across futuristic data visualization dashboard
Dynamic Financial Data Graph Visualization on Black Background
Red up and down financial graph on grey digital background
Abstract Data Visualization with Graphs over Digital Grid Background
Data Processing Overlay on Circuit Board Background
Dynamic Green Line Graph on Data Grid Background
Premium
Displaying digital dashboard on dark grid background with line graph, gauges, financial index table. Technology, analytics, futuristic, interface, dashboard, innovation, visualization
Digital Network with Declining Graph Overlay
Digital Financial Interface with Dynamic Graphs and Data Analysis
Dynamic Graph Analysis over Covid-19 Virus Cells
Financial Data Growth Over Urban Cityscape with Graph Overlay
Premium
Displaying red line graph traversing black grid on data screen with HUD rings and numeric labels. Futuristic, technology, analytics, interface, digital, innovation, progress
Green Line Graph on Blue Digital Office Background
Global Data Exchange Network
Digital Display of Financial Decline Graph and Data Connectivity
Abstract Financial Graph with Upward Trend Line
Businesswoman with Suitcase Walking Viewed Through Financial Analytics
Descending Financial Graph on Global Grid Background
Financial Analytics Chart in Digital Interface Design
Digital Graph Showing Economic Recession on Globe Background
Premium
Displaying trading dashboard on screen showing candlesticks bar and line graphs, numeric indicators. Finance, stockmarket, analytics, data visualization, technology, investment, digital interface
Green Line Graph Overlaying Modern Office Setting
Futuristic HUD cockpit displaying holographic telemetry, navigation and green performance graph
Dynamic Growth Over Time on Grid Background
Displaying Radar Grid with Red Jagged Trend Line on Futuristic HUD Analytics Interface
Premium
Displaying turquoise padlock icon securing data on financial interface with bar and line chart data. Cybersecurity, technology, innovation, finance, encryption, protection, analytics
Green Upward Trend Line Climbing 3D Grid Interactive Dashboard for Financial Analytics
Dynamic Chart and Globe Depict Global Financial Movement
Futuristic Financial Graphs with Dynamic Green Line
Digital Green Graph Lines on Grid Showing Business Analytics
Neon Stadium and Data Integration in Digital Interface
Rising Green Graph Lines over Business Data
Premium
Displaying financial data on dark grid UI, showing bar charts, candlesticks, line graphs and gauges. Analytics, data visualization, digital interface, financial technology, futurism, dashboard,
Premium
Image of financial data processing over colourful lines on black background. Finances, business, computing and digital interface concept digitally generated image.
Premium
Displaying transparent data table overlaying screen, tracing line graphs and turquoise dot clusters. Analytics, data visualization, cybersecurity, technology, digital interface, performance,
Rising Green Line on Financial Digital Display
Abstract Digital Graph with Data Visuals and Scope Interface
Financial Market Decline Illustrated on Grid Chart
Rising Chart Line Over Digital Grid Representing Financial Growth
Premium
Showing 3D bar chart columns emerging on holographic grid, with line graphs and numeric labels. Futuristic, data, analytics, holographic, visualization, digital, market
Growing Success Trend with Data Chart over Pink Gradient
Dynamic Financial Growth Chart in Modern Office
Digital Fingerprint with Rising Statistic Line and Data Interface
Dynamic Statistical Graphs on Gradient Background
Premium
Displaying rising line chart '17.81%' on finance grid dashboard with tickers, panels, lens flare. Data visualization, financial analytics, technology, digital interface, investment, business,
Abstract Financial Graphs Displaying Market Trends
Dynamic Stock Market Graph Fluctuating in Modern Office
Dynamic Red Line Graph on Dark Background Depicting Financial Crisis
Premium
Displaying aqua-colored line graph fluctuating over dashboard, with ticker and lattice grid. Technology, analytics, digital, data visualization, finance, network, abstract
Graph Data Visualization on Blue 3D Grid Design
Dynamic Green Business Data Graph with Office Backdrop
Financial Data Graph Overlaying Cityscape Illustration
Data Trends Visualization Over Virus Background
Premium
Data visualization running in virtual dashboard, with pie charts line charts and percentage labels. Analytics, infographics, digital interface, dashboard, business intelligence, corporate, screen
Digital Lock with Real-Time Data Display
Financial Data Graph with Rising Green Line and Analytics Dashboard
Dynamic Financial Data Visualization Chart with Trending Lines
Digital Stock Market Data with Upward Trend Graph
Rising Data Graph with Changing Numbers on Blue Grid
Premium
Businessman holding smartphone with holographic financial graph. Concept of digital finance, stock market, big data analytics, and modern business technology.
Stock Market Decline Data Analysis on Dark Grid Background
Premium
financial, finance, investment, chart, graph, invest, interface, indicator, rising, stock. typing data for calculation risk control investment. financial finance interface indicator. line is growth up
Global Financial Market Downturn Depicted on Digital World Map
Dynamic Global Data Insights with Trend Lines
Abstract Digital Art of Purple Shapes on Textured Blue Background
Dynamic Financial Growth Graph on Blue Grid Background
Premium
Displaying holographic grid rotating arcs in dashboard, with financial table, copy space. Futuristic, data visualization, digital interface, holographic, technology, analytics, control panel
Green Line Graph Over Digital Grid Highlighting Data Trends
Red Financial Graph Indicates Declining Market Trends
Economic Crisis Graph Over Ukraine Flag Illustrating Financial Downturn
Dynamic Financial Market Graph with Data Points
Premium
Businessman search and analyze using on-line app on phone. Financial graph hologram.
Global Economic Trend Representation on Digital World Map
Financial Chart with Falling Trends in Corporate Environment
Dynamic Financial Data and Analytics with Euro Symbol
Dynamic Data Trends on Digital Display for Financial Analysis
Premium
Office woman take note in business papers. Digital hud earth globe with stock market changes, forex data information, bar chart and lines. Concept of data storage
Red Financial Trendline in Digital Interface Background
Digital Data Visualization with Dynamic Graph and Global Interface
Dynamic Red Line Graph on Digital Black Grid Background
Interactive Financial Graph with Economics Concept
Premium
Displaying monitor with financial dashboard at desk with magenta and cyan graphs, minecode.py table. Analytics, data visualization, dashboard, technology, digital, insights, software
Data Center with Rising Trends on Digital Graph
Digital Data Processing with Grid Interface
Declining Financial Graph Over Data Grid with Global Background
Digital Data Analysis Concept with Graph on Grid Background
Premium
Displaying white circular gauge showing line graph and readout at financial dashboard, with tickers. Dashboard, analytics, technology, network, finance, visualization, data
Dynamic Financial Chart with Currency Symbols and Digital Network
Dynamic Data Trends Over Digital Graph with Pink Background
Abstract Financial Data and Stock Market Analysis Background
Dynamic Financial Data Chart with Red Trend Line on Green Background
Global Market Trends Featuring Multi-Series Line Charts Over Dotted World Map and Grid
Waveform Graph with Red Line Over Grid and Eyeglasses Symbolizing Analytics
Green Line Graph on Grid Interface Displaying Financial Data Trends
Digital Interface Displaying Volatile Financial Market Analysis
Digital Interface with Overlapping Code and Graph
Global Financial Data and Social Media Escalation Chart
Green Line Graph Overlaid on Empty Office with Data Overlay
Visualizing neon purple finance dashboard with stepped bar chart and magenta node line
Premium
Showing line graph 2008–2015 on dashboard with bar charts and histograms, gridlines and labels. Data visualization, analytics, digital interface, financial analysis, business intelligence,
Digital Financial Graphs Overlapping Modern Office Scene
Digital Decline Graphic with QR Code Elements and Red Line
Green Energy Graph with Analytics Icons and Data on Dashboard
Falling Line Graph Illustrates Decreasing Financial Trends
Premium
Showing financial data dashboard visualization at virtual interface, with candlesticks and 54.05. Financial, analytics, visualization, digital, gauge, interface, technology
Futuristic Data Graph Overlay on Urban Cityscape
Dynamic Graphs Depicting Financial Trends on Purple Grid Background
Financial Market Chart on Digital Screen Showing Growing Trends
Dynamic Line Graph on Business Office Background Depicting Growth
Premium
financial, finance, investment, chart, graph, invest, interface, stock, trade, statistic. touching at touchpad for check benefit of my investment and then buy new position the stock. financial trader.
Financial Data Integration with Agricultural and Environmental Landscapes
Premium
Displaying dashboard showing cyan line graph flowing over candlestick bars on grid, with pie icon. Analytics, data, visualization, technology, interface, digital, futuristic
Red Zigzag Trend Lines Crossing Dark Binary Grid Representing Financial Data Fluctuations
Rising Trend in Financial Analysis Overlaid on Laptop Silhouette
Digital Data Analysis with Network Connections on a Grid Background
Green Financial Data Chart with Technological Overlay
Premium
Displaying market chart on trading interface, with bars, candlesticks, line graphs and grid overlay. Financial, data, analytics, digital, modern, technology, investment
Dynamic Data Visualization with Green Graph Lines on White Background
Dynamic Financial Growth Trends with Analytics Visualization
Explore More Free Stock Images