- Home >
- Stock Photos >
- Financial Data Visualization with Gridlines and Trends
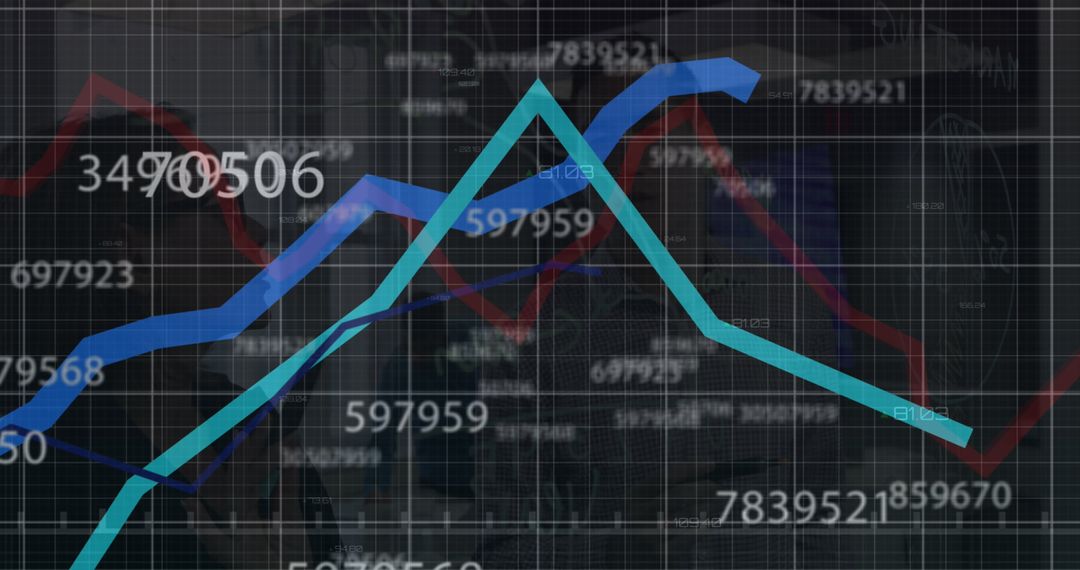
Financial Data Visualization with Gridlines and Trends Image

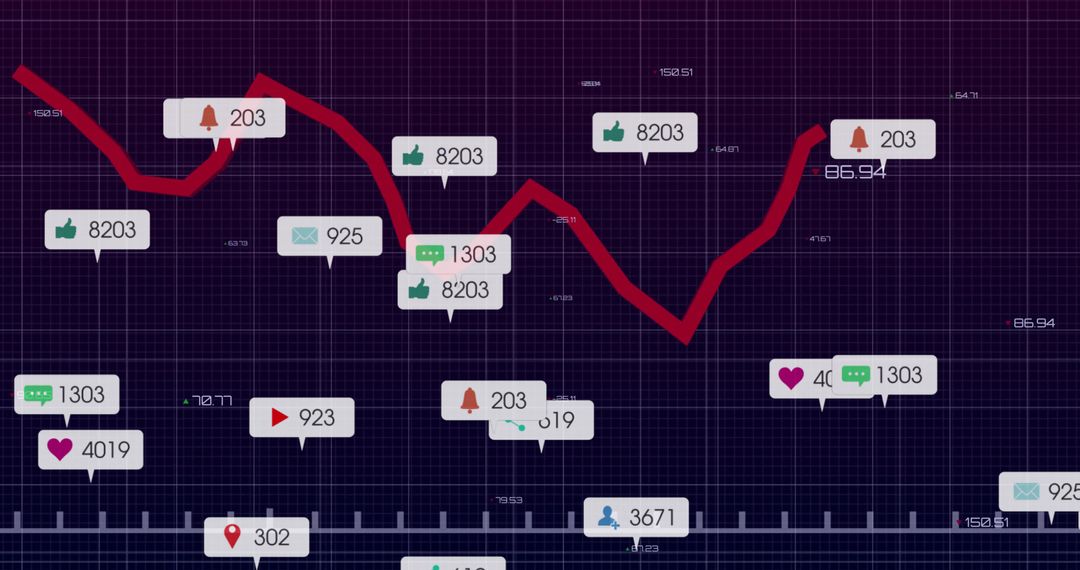
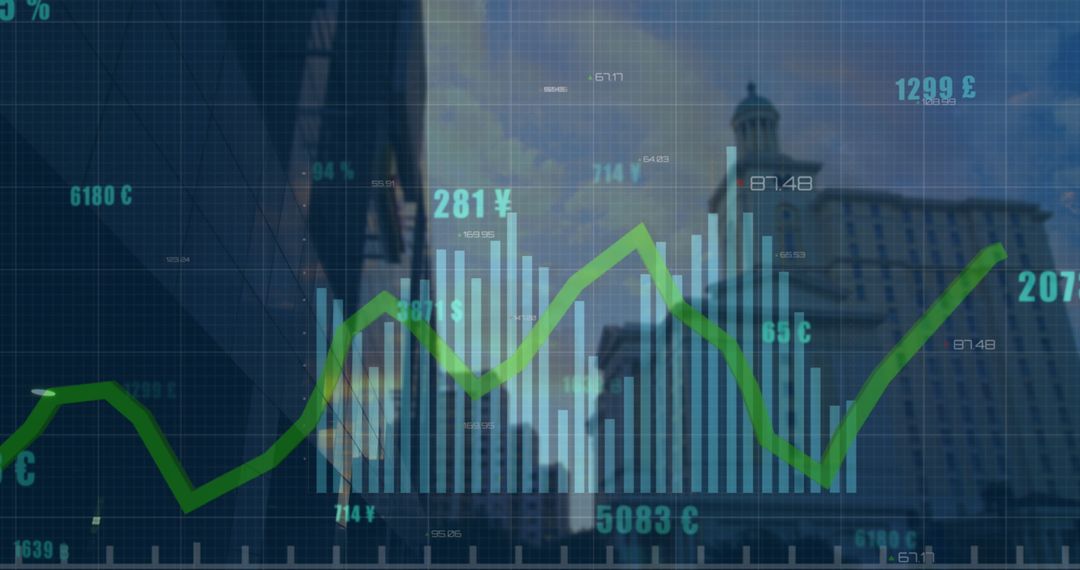
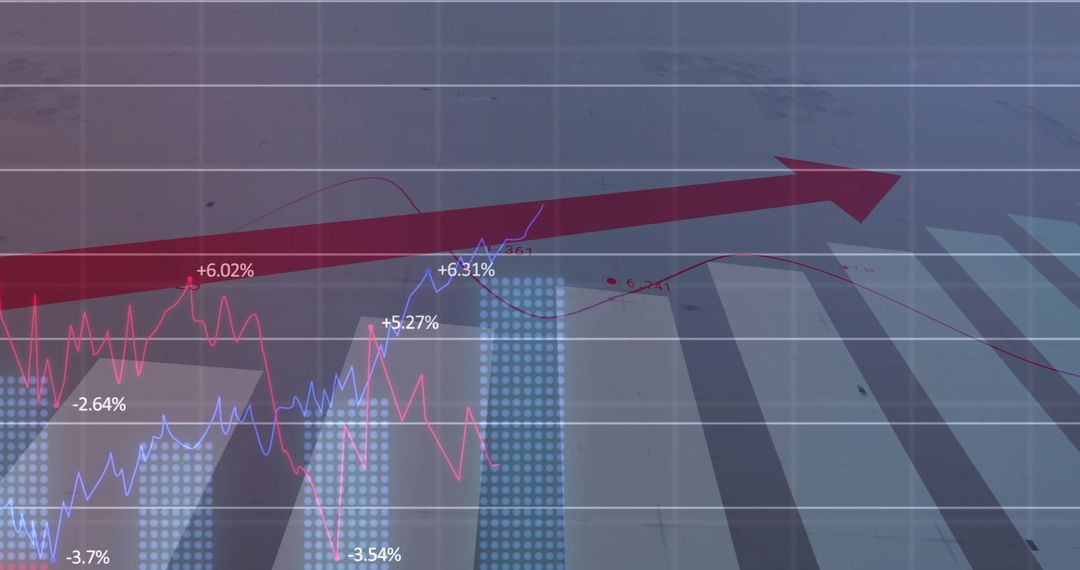
Visual illustration depicts complex financial data, highlighting market trends and business intelligence features both red and blue trend lines alongside bar charts. Ideal for presentations on economic analysis, financial forecasting, and business strategies. Suitable as visual aid in financial reports and educational resources focused on finance and economics.
Powered by 


0
downloads
downloads
Tags:
More
Credit Photo
If you would like to credit the Photo, here are some ways you can do so
Text Link
photo Link
<span class="text-link">
<span>
<a target="_blank" href=https://pikwizard.com/photo/financial-data-visualization-with-gridlines-and-trends/c8e5917400d67e8614166edb55121736/>PikWizard</a>
</span>
</span>
<span class="image-link">
<span
style="margin: 0 0 20px 0; display: inline-block; vertical-align: middle; width: 100%;"
>
<a
target="_blank"
href="https://pikwizard.com/photo/financial-data-visualization-with-gridlines-and-trends/c8e5917400d67e8614166edb55121736/"
style="text-decoration: none; font-size: 10px; margin: 0;"
>
<img src="https://pikwizard.com/pw/medium/c8e5917400d67e8614166edb55121736.jpg" style="margin: 0; width: 100%;" alt="" />
<p style="font-size: 12px; margin: 0;">PikWizard</p>
</a>
</span>
</span>
Free (free of charge)
Free for personal and commercial use.
Author: People Creations
Similar Free Stock Images

Premium


Premium


Premium


Premium


Premium


Premium


Premium


Premium


Premium


Premium


Premium


Premium


Premium


Premium


Premium


Premium


Premium


Premium


Premium


Premium


Premium


Premium


Premium


Premium