1. Home > 
  2. Stock Photos > 
  3. Financial Data Visualization with Growing Business Charts

Financial Data Visualization with Growing Business Charts Image

Financial Data Visualization with Growing Business Charts

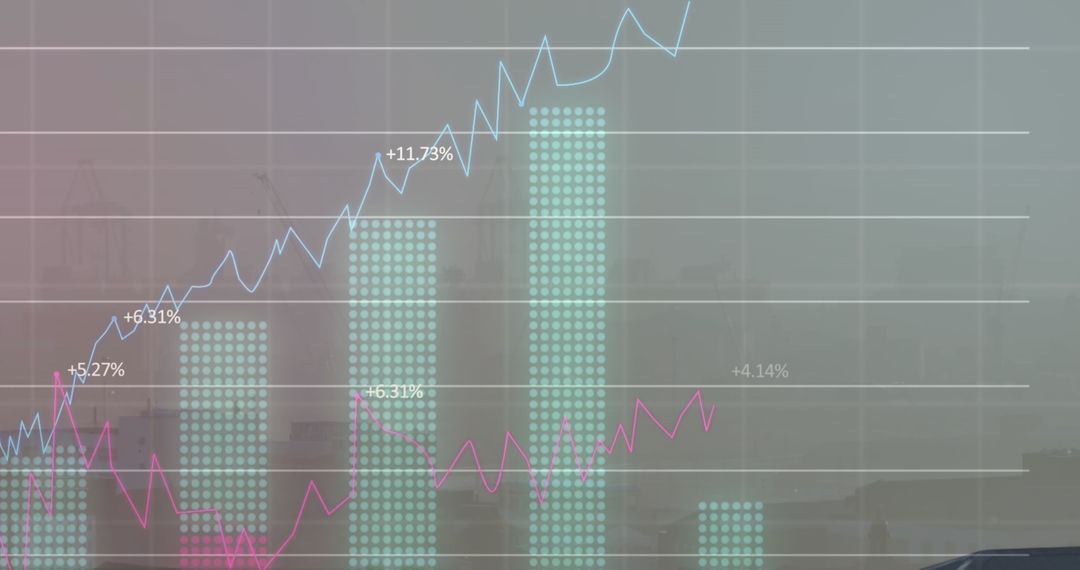
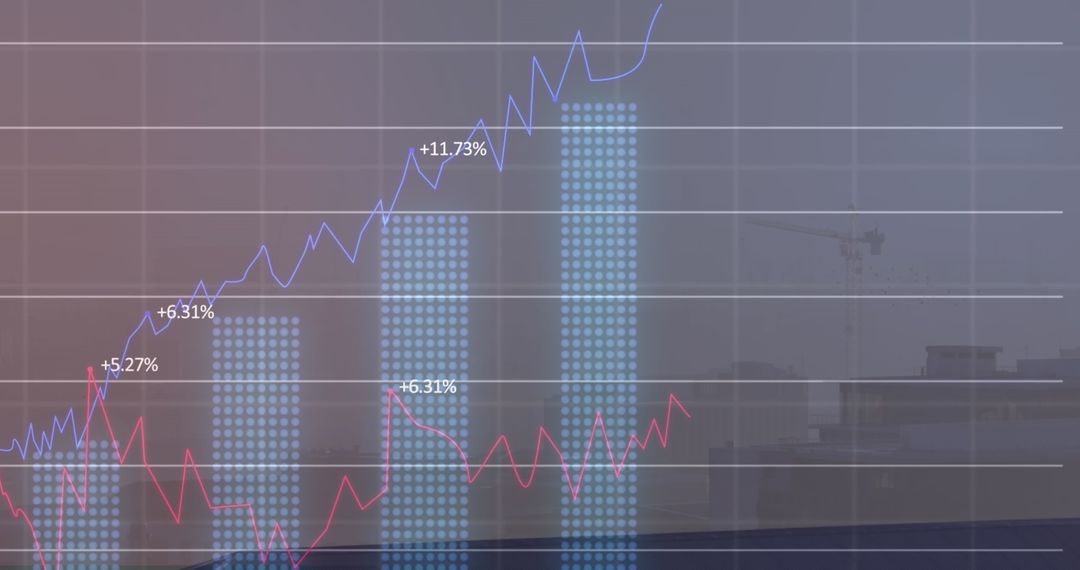
This image of financial data visualization features growing business charts and statistical figures overlaid on a digital grid, symbolizing the concepts of market analysis and economic tracking. The upward lines represent rising trends like revenue growth, profit increase, and positive investment performance. This could be used in business presentations, financial reports, investor updates, or educational materials illustrating economic concepts.

Powered by Adobe logo
Digital forex and stock market chart with upward arrows and glowing data on dark screen background showing financial growth trends. 3D Rendering - Powered by AdobeBusiness meeting showcases agile brainstorming with data analysis charts on tablets. Financial growth prediction strategy through predictive analytics and data-driven insights for strategic business  - Powered by AdobeAmerican flag waving in front of a city skyline with financial growth charts and stock market data overlayed at dusk - Powered by AdobeBusiness man in formal suit points chart data on digital interactive whiteboard screen during business presentation meeting. Speaker explains financial market analytics. Modern business conference - Powered by AdobeAnalyzing financial growth charts for strategic business decisions and investment opportunities, envisioning success with data-driven insights and projections - Powered by Adobe

Credit Photo

If you would like to credit the Photo, here are some ways you can do so

Free (free of charge)

Free for personal and commercial use.

Author: Awesome Content

Similar Free Stock Images

Colorful Stock Market Display with Graphs and Tickers on Blue Background
Premium
An African American Businessman Presentation on Sales Data Analysis in Modern Office
Global Financial Data Overlay with High-Tech Cityscape
Financial Data Overlay on Modern Cityscape Illustrating Market Trends
Dynamic Stock Market Data on Digital Display Background
Dynamic Financial Charts with Blue Digital Interface
Premium
Blue growth graph business chart data diagram on success financial presentation background
Financial Data Over Electric Sky Concept for Energy Sector
Diverse Graphs and Data Over Urban Landscape
Finance Data Visualization in Urban Cityscape Background
Digital Financial Data and Statistics Analyzing Concept
Premium
Two businesswomen analyzing financial charts and having a meeting
Global Stock Trading Concepts with Dynamic Data Visualizations
Digital Data Processing Overlay on Cityscape at Dusk
Financial Data Processing with Digital Graph Overlay
Dynamic Financial Graphs on Digital Screen Displaying Market Trends
Premium
Professional woman analyzing data on a curved monitor. Charts and graphs display performance, strategy, and financial insights. Great for business  tech.
Financial Data Analytics with City Skyline Overlay
Dynamic Stock Market Data and Cityscape Background
Soundwaves with Graph Overlays in Data Processing Concept
Financial Data Analysis and Global Market Trends
Premium
A businesswoman analyzes financial documents with charts and graphs at a desk, highlighting data trends with a pen in a bright, professional office setting.
Financial Growth Chart with Digital Data Interface
Statistics and Data Processing with Graphs and Charts
Financial Data and Cityscape at Night with Rising Graph
Dynamic Financial Data Charts and Digital Interface Concepts
Premium
Data analyzing and stock market visualization with digital charts, financial dashboards, and performance metrics. Ideal for investment analysis, trading strategy, and economic forecasting.
Dynamic Financial Data Graph Illustrating Stock Market Trends
Digital Financial Analytics Dashboard Displaying Diverse Data Visualizations
Digital Financial Chart with Line plots and Bar Columns
Global Trade Gowth Insights Amidst Shipping Landscape
Digital Financial Data Stream with Numeric Overlay
Global Financial Markets and Technology Analysis
Premium
Businessman analyzing financial data on futuristic digital screen with graphs and charts on a dark background, showcasing the finance growth concept.
Financial Graphs with Cityscape Background Reflecting Market Trends
Digital Financial Data Overlay on World Map
Financial Data Display in Digital Grid Design
Financial Data Analysis Graph with Growing Trends
Premium
Magnifying glass reveals detailed stock market candlestick chart on financial report, symbolizing investment analysis and business growth. Ai Generated Images
Dynamic Stock Market Graphics on Modern Digital Interface
Digital Data Visualization with Futuristic Infographics
Colombian Stock Market Data Amid Colored Background
Dynamic Digital Financial Interfaces over Urban Cityscape
Premium
Professional Latina woman sits at desk in coworking office, focused on her work, looking at computer screen displaying financial charts and stock market data related to trading or financial analysis
Futuristic Data Recovery Concept on Digital Interface
Statistical Graphs Over Cityscape Highlighting Business Growth
Global Data Analytics and Network Visualization on Digital Grid
Digital Fingerprint Overlayed on Financial Data Illustrating Cybersecurity
Premium
Business report showing charts and graphs on a clipboard for data analysis on transparent background
Futuristic Data Chart with Digital Interface Elements
Dynamic Stock Market Graph with Percentage Indicators
Abstract Financial Data Over Cityscape Imagery
Global Financial Data Analysis on Grid Background
Premium
A confident businessman presents financial data to a diverse team during a corporate meeting.
Global Financial Analytics on Digital World Map
Financial Data Processing with Charts and Graphics on Digital Blue Background
Dynamic Financial Data Growth Chart Display
Futuristic Stock Market Graphs on Digital Display
Premium
Business people collaborating in an office, analyzing financial charts and graphs with pens in hand. Utilizing calculators, tablets, and notebooks to strategize and plan for growth
Financial Trends Analytics Over Cityscape at Dusk
Financial Charts with Blue and Red Lines and Digital Percent Indicators
Financial Data with Urban Harbor Background Showing Industry Insights
Futuristic Digital Interface with City Overlay and Data Graphs
Financial Visualization Overlooking Urban Cityscape
Digital Graphs and Charts on Tech Background Illustrating Data Analysis
Premium
Data Analysis and Reporting. Business professional analyzing financial charts on laptop.
Digital Interface Displaying Stock Market Data and Statistics
Abstract Graph Display with Dynamic Business Growth Indicators
Abstract Financial Data Visualization with Global Connections
Digital Data with Financial Graphs on Global Grid
Premium
Man types on laptop with data charts and graphs overlay for business analysis
City Skyline with Digital Data Overlay Depicting Financial Growth
Abstract City Traffic Analytics with Data Overlay
Financial Data Visualization with Urban Nightscape
Digital Visualization Financial Data Growth Progressive Graph
Premium
Business financial chart with moving up arrow graph.Financial data charts with glowing stock market graphs.Stock market investment data and analysis finance graph.
Modern Digital Financial Chart Interface with Fluctuating Graphs
Dynamic Financial Graphs Illustrating Business Growth
Finance and Technology Theme with Stock Market Data Overlay
Financial Data Chart with Rising Trends Overlaid on Cityscape Background
Premium
The magnifying glass highlighting financial data and market trends on paper.
Dynamic Data Analytics Interface Showing Statistical Trends
Digital Connection Network with Global Business Data Streams
Financial Data Visualization on Dark Background for Analysis
Digital Data Interface with Global Financial Statistics
Premium
Photo of a grayscale image showcases a tablet displaying intricate data analytics and financial information, highlighting the importance of technology in modern business strategies
Financial Graph Illustrating Stock Market Growth Over Cityscape
Dynamic Digital Interface Displaying Financial Data Analysis
Digital Data Visualization Overlaying Sports Stadium
Futuristic Urban Analytics with Overlaid Graphs and Data Tags
Premium
Professional team reviewing financial documents, pointing at charts on desk, collaborating to analyze data and strategize business growth. Business people concept
Rising Data Trends in Urban Landscape with Translucent Chart Overlay
Financial Data Dashboard Displaying Dual Trend Lines, Percentage Labels Interactive Metrics
Global Finance and Economy Interface with Digital Graphs
Financial Graph Data Overlay with Modern Cityscape Background
Digital Data Analysis with Futuristic Charts
Abstract Financial Graphs Overlapping Urban Skyline
Premium
A corporate data management expert analyzing real-time financial and business data on a large digital screen, showcasing market trends, analytics, and strategic insights in a modern office
Rising Financial Graphs with Digital Data Interface
Dynamic Financial Graphs with Cityscape and Global Finance Theme
Digital Finance Technology with Global Interconnection
Rising Graphs and Interactive Financial Data Analytics Background
Premium
Upward market arrow on digital chart expressing business growth financial performance improvement and confident data driven strategy execution.
Digital Financial Data Graph with Winter Snowflake Theme
Stock Market Trends and Data Analysis over Digital Grid
Financial Graphs Overlaying Cityscape Illustrate Global Economy
Financial Data Visualization with Graphs and Charts on Navy Background
Premium
Laptop screen displaying financial data charts.
Digital Fingerprint with Data Overlay on Futuristic Interface
Financial Growth Chart Over Urban Cityscape, Business Data Concept
Analyzing Statistical Data Over Digital Network With Cityscape
Dynamic Stock Market Analysis on Digital Screen
Premium
Collaborative business meeting featuring a team reviewing financial charts and a tablet device, Corporate analysis and reporting of data with a team approach to office technology
Dynamic Financial Data Charts and Graphs Background
Digital Charts Highlighting Global Finance Data Insights
Dynamic Financial Data with Global Connections and Insights
Financial Data Projection in Modern Office Space
Premium
Magnifying glass over financial charts and graphs showing data analysis and growth
Financial Data Stock Analysis with Code Overlays
Dynamic Financial Data Analytics with Stock Market Trends
Financial Data Visualization with Charts and Graphs on Dashboard
Financial Analytics Dashboard with Growth Trends and Indicators
Premium
Laptop screen displaying financial charts
Futuristic Financial Dashboard Showing Layered Market Charts and Colored Trend Lines