
- Home >
- Stock Photos >
- Financial Data Visualization with Horizontal Bar Charts
Financial Data Visualization with Horizontal Bar Charts Image
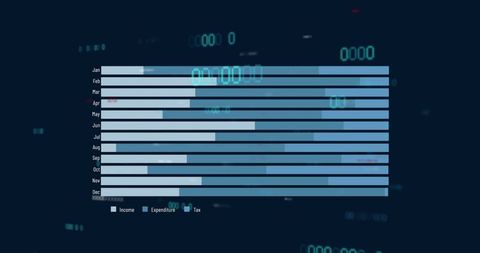
This image features horizontal bar charts displaying financial data including income, expenditure, and tax for each month. The chart is set against a dark background that accentuates the digital financial theme with numbers and coding motifs subtly integrated. This image can be used in presentations or publications related to finance, economic trends, data analysis, or investment strategies. Perfect for financial analysts, economists, and educators who require visual aids in their presentations.
Powered by  - Get 15% off with code: PIKWIZARD15


downloads
Tags:
More
Credit Photo
If you would like to credit the Photo, here are some ways you can do so
Text Link
photo Link
<span class="text-link">
<span>
<a target="_blank" href=https://pikwizard.com/photo/financial-data-visualization-with-horizontal-bar-charts/da075ebea7b4b4218f16fbf242e3d914/>PikWizard</a>
</span>
</span>
<span class="image-link">
<span
style="margin: 0 0 20px 0; display: inline-block; vertical-align: middle; width: 100%;"
>
<a
target="_blank"
href="https://pikwizard.com/photo/financial-data-visualization-with-horizontal-bar-charts/da075ebea7b4b4218f16fbf242e3d914/"
style="text-decoration: none; font-size: 10px; margin: 0;"
>
<img src="https://pikwizard.com/pw/medium/da075ebea7b4b4218f16fbf242e3d914.jpg" style="margin: 0; width: 100%;" alt="" />
<p style="font-size: 12px; margin: 0;">PikWizard</p>
</a>
</span>
</span>
Free (free of charge)
Free for personal and commercial use.
Author: Awesome Content