
- Home >
- Stock Photos >
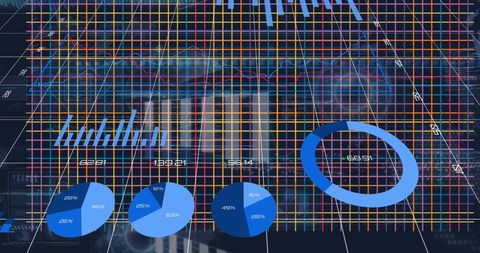
- Financial Data Visualization with Overlapping Charts on Grid
Financial Data Visualization with Overlapping Charts on Grid Image
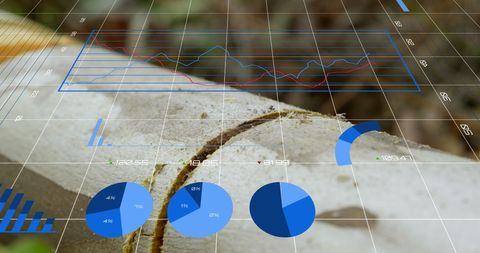
An illustration depicting financial graphs displayed over a grid background. Charts and graphs, with a clear digital interface, represent abstract data processing concepts. Ideal for use in presentations or materials related to finance, investment analysis, economic research, and data-driven decision-making.
Powered by 


downloads
Tags:
More
Credit Photo
If you would like to credit the Photo, here are some ways you can do so
Text Link
photo Link
<span class="text-link">
<span>
<a target="_blank" href=https://pikwizard.com/photo/financial-data-visualization-with-overlapping-charts-on-grid/566dc1dfee5c6474f497e30a7f5706bf/>PikWizard</a>
</span>
</span>
<span class="image-link">
<span
style="margin: 0 0 20px 0; display: inline-block; vertical-align: middle; width: 100%;"
>
<a
target="_blank"
href="https://pikwizard.com/photo/financial-data-visualization-with-overlapping-charts-on-grid/566dc1dfee5c6474f497e30a7f5706bf/"
style="text-decoration: none; font-size: 10px; margin: 0;"
>
<img src="https://pikwizard.com/pw/medium/566dc1dfee5c6474f497e30a7f5706bf.jpg" style="margin: 0; width: 100%;" alt="" />
<p style="font-size: 12px; margin: 0;">PikWizard</p>
</a>
</span>
</span>
Free (free of charge)
Free for personal and commercial use.
Author: People Creations
Similar Free Stock Images

Premium


Premium

Explore More Free Stock Images