- Home >
- Stock Photos >
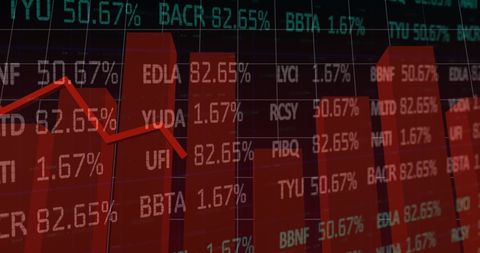
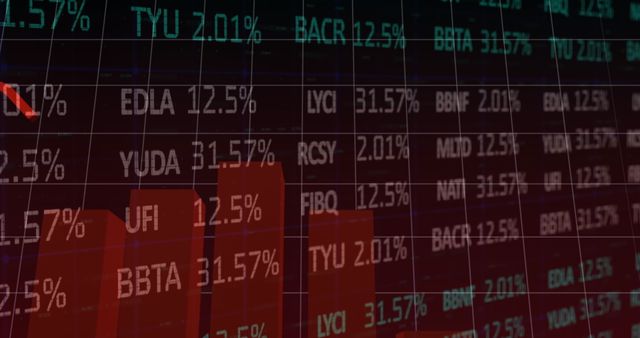
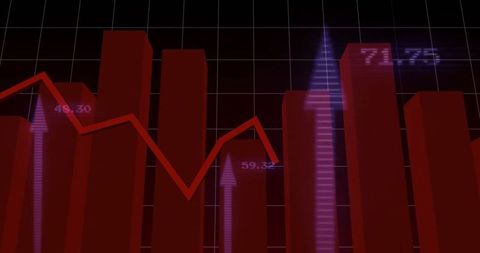
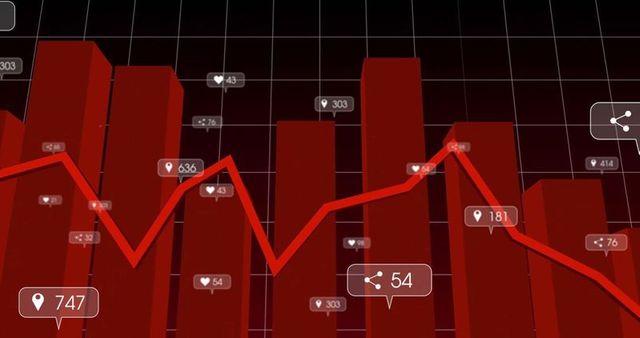
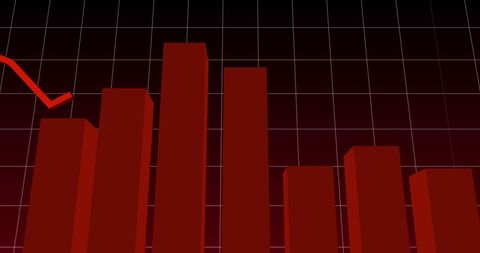
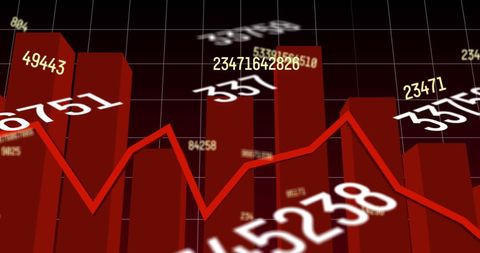
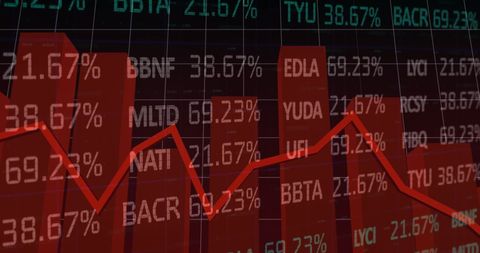
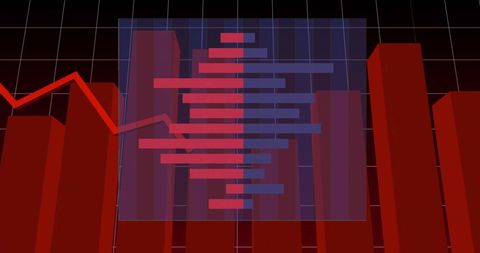
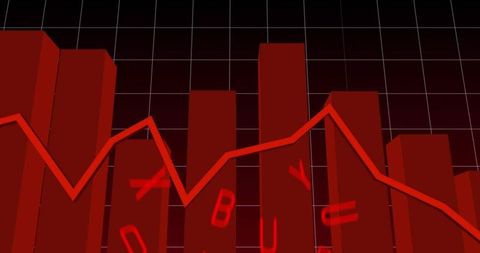
- Financial Data Visualization with Red Bar Graphs and Digital Numbers
Financial Data Visualization with Red Bar Graphs and Digital Numbers Image
Digitally generated image showcasing dynamic financial data through vivid red bar graphs and numerical projections, suggesting monitoring or analysis of market trends. Useful for illustrating business reports, financial articles, stock market reviews, and presentations highlighting economic or investment trends.

downloads
Tags:
More
Credit Photo
If you would like to credit the Photo, here are some ways you can do so
Text Link
photo Link
<span class="text-link">
<span>
<a target="_blank" href=https://pikwizard.com/photo/financial-data-visualization-with-red-bar-graphs-and-digital-numbers/ac2227d87cc7c3df67be773ae1de8b4f/>PikWizard</a>
</span>
</span>
<span class="image-link">
<span
style="margin: 0 0 20px 0; display: inline-block; vertical-align: middle; width: 100%;"
>
<a
target="_blank"
href="https://pikwizard.com/photo/financial-data-visualization-with-red-bar-graphs-and-digital-numbers/ac2227d87cc7c3df67be773ae1de8b4f/"
style="text-decoration: none; font-size: 10px; margin: 0;"
>
<img src="https://pikwizard.com/pw/medium/ac2227d87cc7c3df67be773ae1de8b4f.jpg" style="margin: 0; width: 100%;" alt="" />
<p style="font-size: 12px; margin: 0;">PikWizard</p>
</a>
</span>
</span>
Free (free of charge)
Free for personal and commercial use.
Author: Creative Art