- Home >
- Stock Photos >
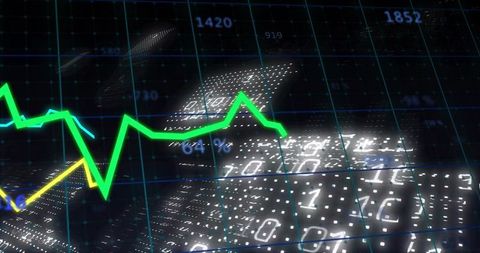
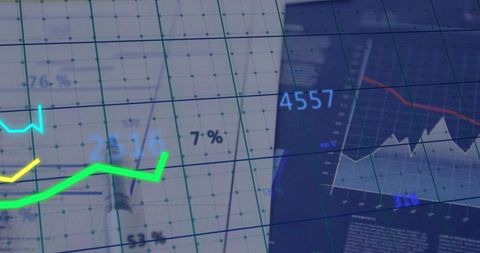
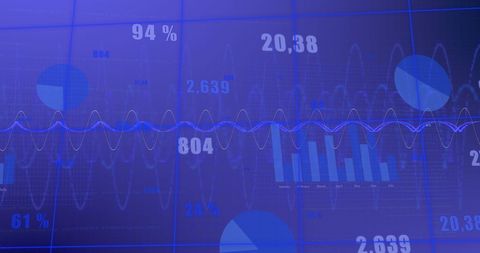
- Financial Data Visualization with Rising Trends
Financial Data Visualization with Rising Trends Image

Line graph depicting real-time financial market analysis, ideal for representing global business trends, trading markets, or economic strategy sessions. Useful for illustrators of financial articles, market analysts, and economic forecasts.

downloads
Tags:
More
Credit Photo
If you would like to credit the Photo, here are some ways you can do so
Text Link
photo Link
<span class="text-link">
<span>
<a target="_blank" href=https://pikwizard.com/photo/financial-data-visualization-with-rising-trends/9329dd0032cbcdb1d520bdcdbeadda1f/>PikWizard</a>
</span>
</span>
<span class="image-link">
<span
style="margin: 0 0 20px 0; display: inline-block; vertical-align: middle; width: 100%;"
>
<a
target="_blank"
href="https://pikwizard.com/photo/financial-data-visualization-with-rising-trends/9329dd0032cbcdb1d520bdcdbeadda1f/"
style="text-decoration: none; font-size: 10px; margin: 0;"
>
<img src="https://pikwizard.com/pw/medium/9329dd0032cbcdb1d520bdcdbeadda1f.jpg" style="margin: 0; width: 100%;" alt="" />
<p style="font-size: 12px; margin: 0;">PikWizard</p>
</a>
</span>
</span>
Free (free of charge)
Free for personal and commercial use.
Author: Authentic Images