
- Home >
- Stock Photos >
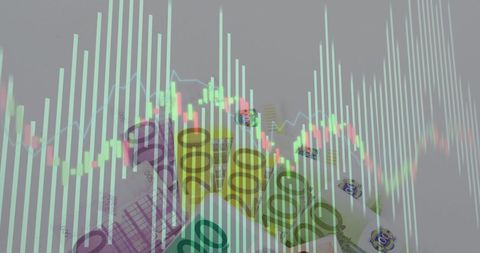
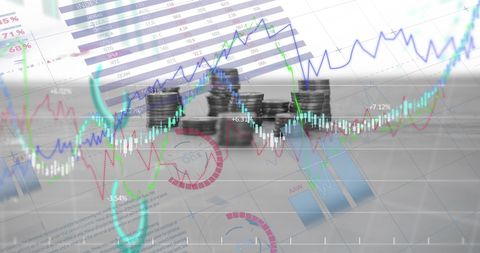
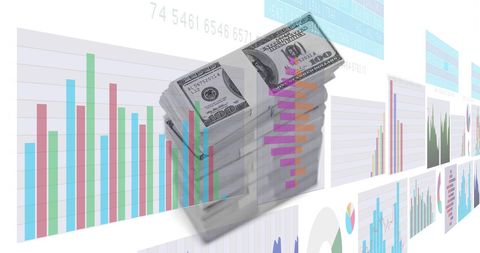
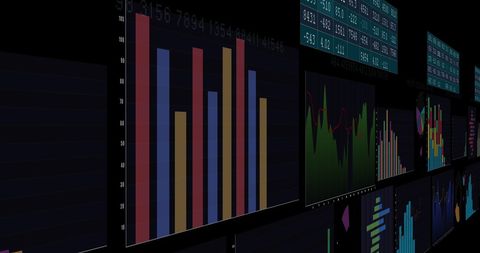
- Financial Data Visualization with Stacked Dollar Bills
Financial Data Visualization with Stacked Dollar Bills Image
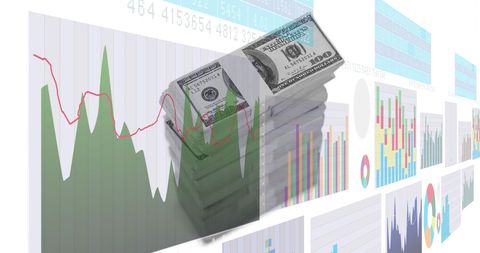
Charts and graphs overlay on stack of US dollars, representing financial trends and data analysis. Use for concepts related to investment strategies, economic growth, financial services advertising, and market analysis presentations.
Powered by  - Get 15% off with code: PIKWIZARD15


downloads
Tags:
More
Credit Photo
If you would like to credit the Photo, here are some ways you can do so
Text Link
photo Link
<span class="text-link">
<span>
<a target="_blank" href=https://pikwizard.com/photo/financial-data-visualization-with-stacked-dollar-bills/da718e1a57d9dac9216d4cabd0ca2a40/>PikWizard</a>
</span>
</span>
<span class="image-link">
<span
style="margin: 0 0 20px 0; display: inline-block; vertical-align: middle; width: 100%;"
>
<a
target="_blank"
href="https://pikwizard.com/photo/financial-data-visualization-with-stacked-dollar-bills/da718e1a57d9dac9216d4cabd0ca2a40/"
style="text-decoration: none; font-size: 10px; margin: 0;"
>
<img src="https://pikwizard.com/pw/medium/da718e1a57d9dac9216d4cabd0ca2a40.jpg" style="margin: 0; width: 100%;" alt="" />
<p style="font-size: 12px; margin: 0;">PikWizard</p>
</a>
</span>
</span>
Free (free of charge)
Free for personal and commercial use.
Author: People Creations
Similar Free Stock Images

Premium

Premium


Premium


Premium

Premium


Premium


Premium

Premium

Premium


Premium

Premium


Premium


Premium


Premium


Premium


Premium


Premium

Premium


Premium

Premium


Premium


Premium


Premium


Premium


Premium


Explore More Free Stock Images