
- Home >
- Stock Photos >
- Financial Data Visualization with Statistics and Graphs
Financial Data Visualization with Statistics and Graphs Image

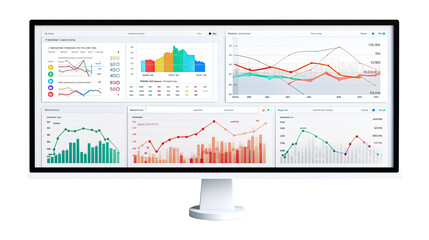
This composition features an intricate mix of statistics and digital visualization focusing on financial data. Ideal for illustrating concepts in finance, stock market analysis, or data-driven strategies, this can be effectively used in articles, presentations, or marketing materials related to financial services.
Powered by 


downloads
Tags:
More
Credit Photo
If you would like to credit the Photo, here are some ways you can do so
Text Link
photo Link
<span class="text-link">
<span>
<a target="_blank" href=https://pikwizard.com/photo/financial-data-visualization-with-statistics-and-graphs/ea1bb1ce54709d1ff3736c957614edd2/>PikWizard</a>
</span>
</span>
<span class="image-link">
<span
style="margin: 0 0 20px 0; display: inline-block; vertical-align: middle; width: 100%;"
>
<a
target="_blank"
href="https://pikwizard.com/photo/financial-data-visualization-with-statistics-and-graphs/ea1bb1ce54709d1ff3736c957614edd2/"
style="text-decoration: none; font-size: 10px; margin: 0;"
>
<img src="https://pikwizard.com/pw/medium/ea1bb1ce54709d1ff3736c957614edd2.jpg" style="margin: 0; width: 100%;" alt="" />
<p style="font-size: 12px; margin: 0;">PikWizard</p>
</a>
</span>
</span>
Free (free of charge)
Free for personal and commercial use.
Author: People Creations
Similar Free Stock Images

Premium


Premium


Premium

Premium


Premium


Premium
Premium


Premium


Premium


Premium


Premium

Premium


Premium


Premium


Premium


Premium


Premium


Premium


Premium

Premium


Premium


Premium

Premium


Premium


Premium


Explore More Free Stock Images