
- Home >
- Stock Photos >
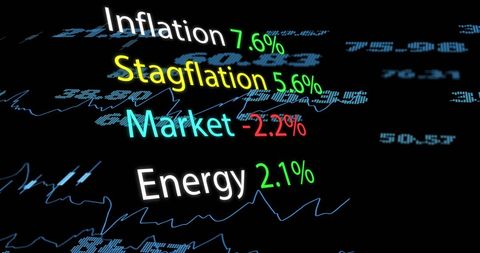
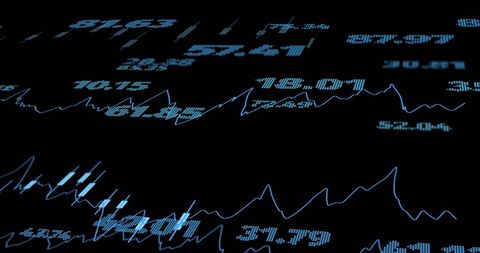
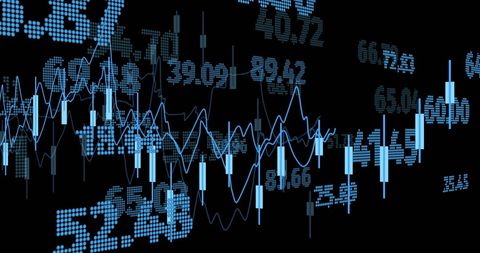
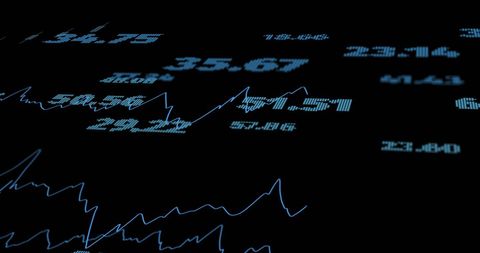
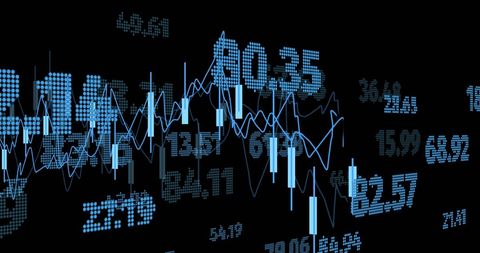
- Financial Data Visualization with Stock Numbers and Charts
Financial Data Visualization with Stock Numbers and Charts Image
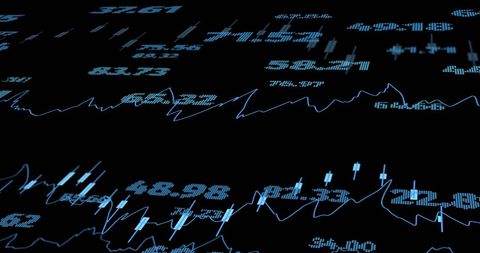
Dynamic illustration of stock market data with numbers and chart lines. Useful for topics related to global finance, economic analysis, investment strategy, and digital corporate presentations. Can be used for illustrating business technologies and analytical services.
Powered by 


downloads
Tags:
More
Credit Photo
If you would like to credit the Photo, here are some ways you can do so
Text Link
photo Link
<span class="text-link">
<span>
<a target="_blank" href=https://pikwizard.com/photo/financial-data-visualization-with-stock-numbers-and-charts/d5fee1ce3aeb00a659657a917942ebdd/>PikWizard</a>
</span>
</span>
<span class="image-link">
<span
style="margin: 0 0 20px 0; display: inline-block; vertical-align: middle; width: 100%;"
>
<a
target="_blank"
href="https://pikwizard.com/photo/financial-data-visualization-with-stock-numbers-and-charts/d5fee1ce3aeb00a659657a917942ebdd/"
style="text-decoration: none; font-size: 10px; margin: 0;"
>
<img src="https://pikwizard.com/pw/medium/d5fee1ce3aeb00a659657a917942ebdd.jpg" style="margin: 0; width: 100%;" alt="" />
<p style="font-size: 12px; margin: 0;">PikWizard</p>
</a>
</span>
</span>
Free (free of charge)
Free for personal and commercial use.
Author: People Creations
Similar Free Stock Images

Premium


Premium

Premium

Premium


Premium


Premium


Premium

Premium


Premium

Premium

Premium


Premium


Premium


Premium


Premium


Premium


Premium


Premium


Premium


Premium


Premium

Premium


Premium


Premium


Premium


Explore More Free Stock Images