
- Home >
- Stock Photos >
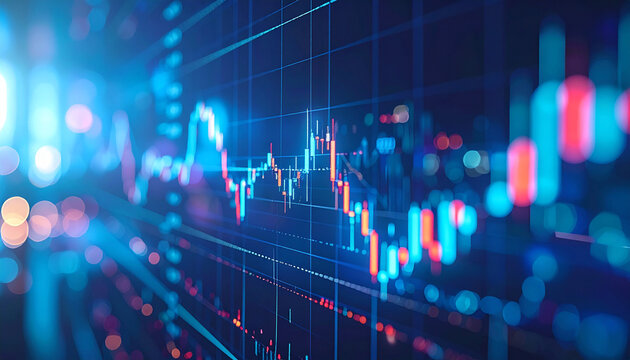
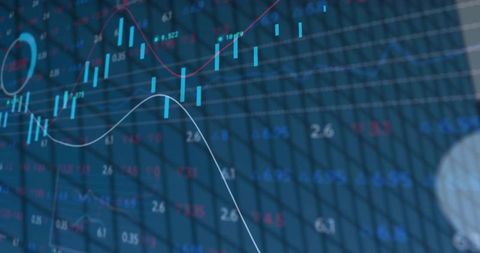
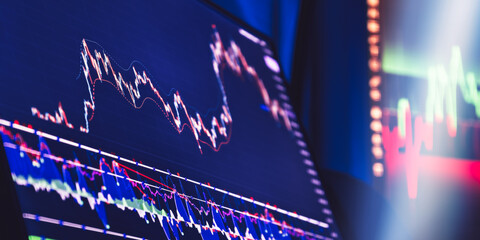
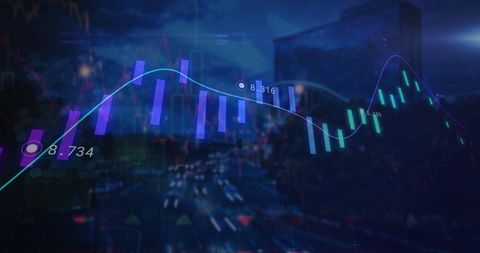
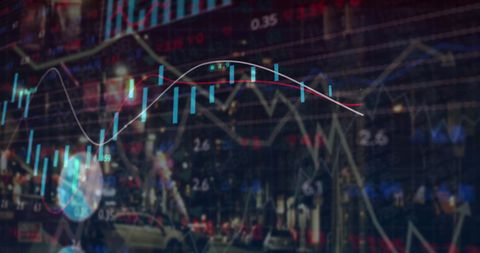
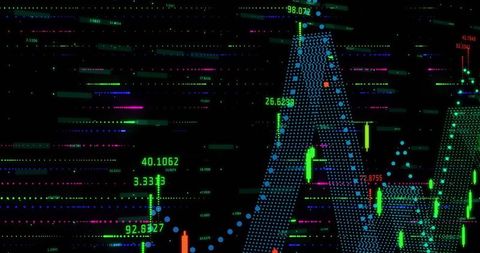
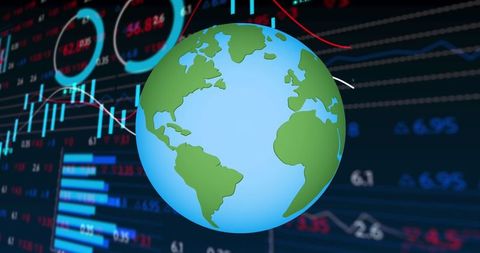
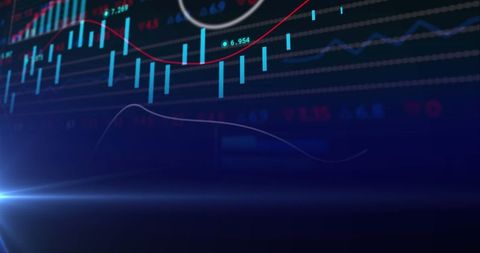
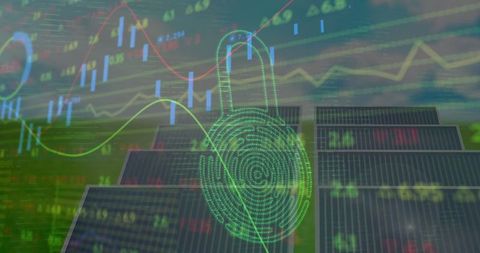
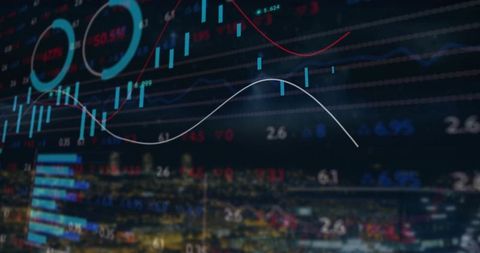
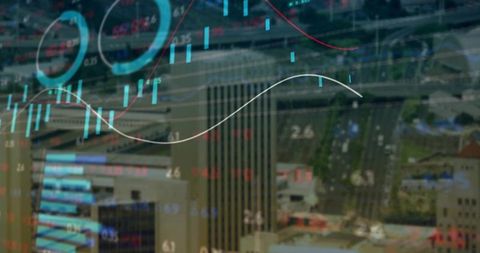
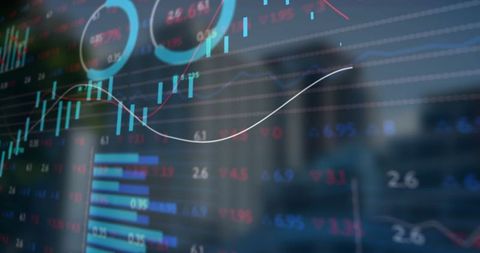
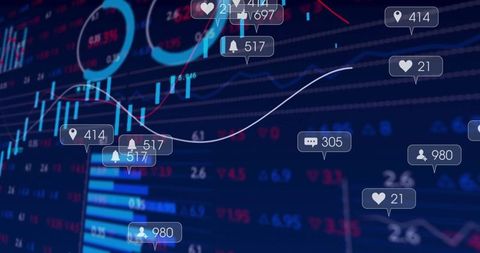
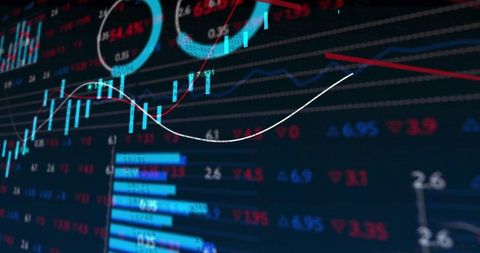
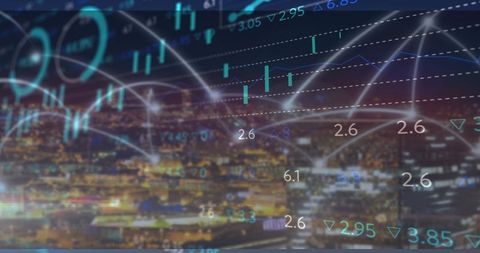
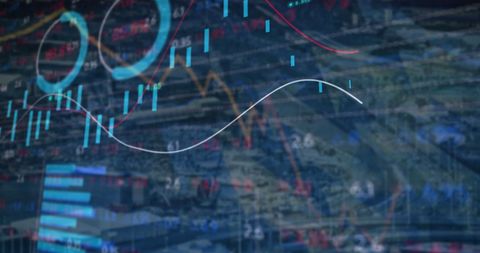
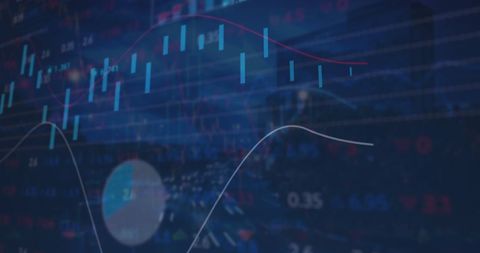
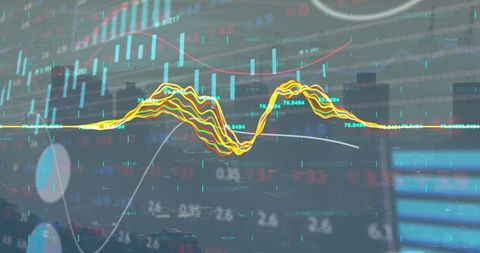
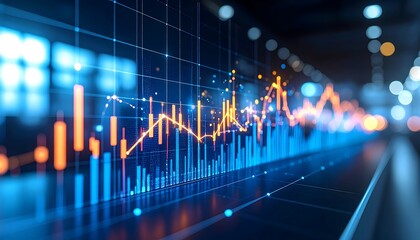
- Financial Data Visualization with Trend Analysis and Candlestick Bars
Financial Data Visualization with Trend Analysis and Candlestick Bars Image
Financial data visualization highlighting a trading dashboard with candlestick charts and trend lines. This digital display emphasizes data analytics and investment tracking, making it ideal for use in financial presentations, investor reports, or educational materials focusing on market trends and data interpretation.
Powered by 


downloads
Tags:
More
Credit Photo
If you would like to credit the Photo, here are some ways you can do so
Text Link
photo Link
<span class="text-link">
<span>
<a target="_blank" href=https://pikwizard.com/photo/financial-data-visualization-with-trend-analysis-and-candlestick-bars/de7bcce38ac6cd6d3af1c13fc0c914b9/>PikWizard</a>
</span>
</span>
<span class="image-link">
<span
style="margin: 0 0 20px 0; display: inline-block; vertical-align: middle; width: 100%;"
>
<a
target="_blank"
href="https://pikwizard.com/photo/financial-data-visualization-with-trend-analysis-and-candlestick-bars/de7bcce38ac6cd6d3af1c13fc0c914b9/"
style="text-decoration: none; font-size: 10px; margin: 0;"
>
<img src="https://pikwizard.com/pw/medium/de7bcce38ac6cd6d3af1c13fc0c914b9.jpg" style="margin: 0; width: 100%;" alt="" />
<p style="font-size: 12px; margin: 0;">PikWizard</p>
</a>
</span>
</span>
Free (free of charge)
Free for personal and commercial use.
Author: People Creations
Similar Free Stock Images
Premium


Premium


Premium


Premium


Premium


Premium
Premium


Premium


Premium


Premium


Premium


Premium


Premium

Premium
Premium


Premium

Premium


Premium


Premium


Premium


Premium


Premium


Premium


Premium


Premium
Explore More Free Stock Images