
- Home >
- Stock Photos >
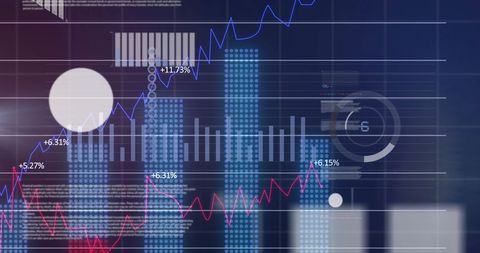
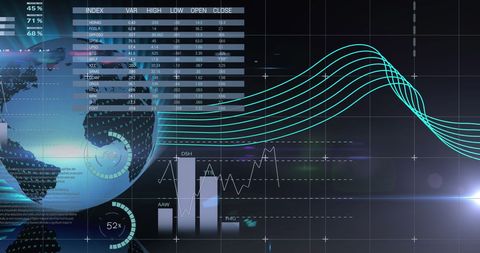
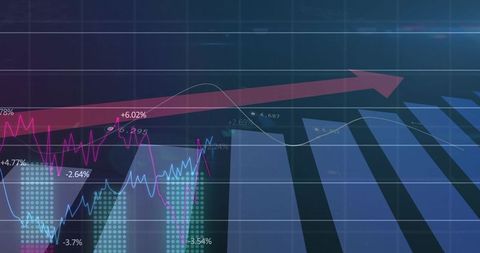
- Financial Data Visualizations and Analytics on Dark Background
Financial Data Visualizations and Analytics on Dark Background Image

This scene highlights digital visualizations of financial and market data, including graphs and charts on a dark backdrop. Useful for business presentations, financial services marketing materials, and articles on technological impact on the finance industry.
Powered by 


downloads
Tags:
More
Credit Photo
If you would like to credit the Photo, here are some ways you can do so
Text Link
photo Link
<span class="text-link">
<span>
<a target="_blank" href=https://pikwizard.com/photo/financial-data-visualizations-and-analytics-on-dark-background/98f1165436c0db26dda12f8b3c9547cd/>PikWizard</a>
</span>
</span>
<span class="image-link">
<span
style="margin: 0 0 20px 0; display: inline-block; vertical-align: middle; width: 100%;"
>
<a
target="_blank"
href="https://pikwizard.com/photo/financial-data-visualizations-and-analytics-on-dark-background/98f1165436c0db26dda12f8b3c9547cd/"
style="text-decoration: none; font-size: 10px; margin: 0;"
>
<img src="https://pikwizard.com/pw/medium/98f1165436c0db26dda12f8b3c9547cd.jpg" style="margin: 0; width: 100%;" alt="" />
<p style="font-size: 12px; margin: 0;">PikWizard</p>
</a>
</span>
</span>
Free (free of charge)
Free for personal and commercial use.
Author: Creative Art
Similar Free Stock Images

Premium


Premium


Premium


Premium


Premium


Premium

Premium


Premium

Premium


Premium

Premium


Premium


Premium


Premium


Premium


Premium


Premium

Premium

Premium


Premium

Premium


Premium


Premium


Premium


Premium


Explore More Free Stock Images