1. Home > 
  2. Stock Photos > 
  3. Financial Data Visualizations on Abstract Blue Background

Financial Data Visualizations on Abstract Blue Background Image

Financial Data Visualizations on Abstract Blue Background

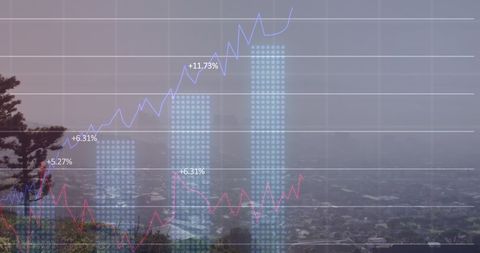
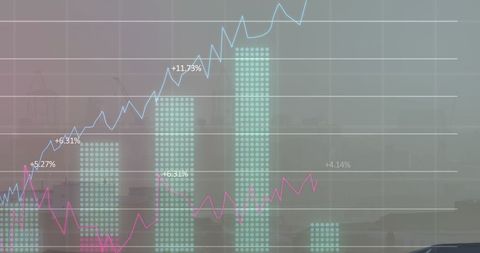
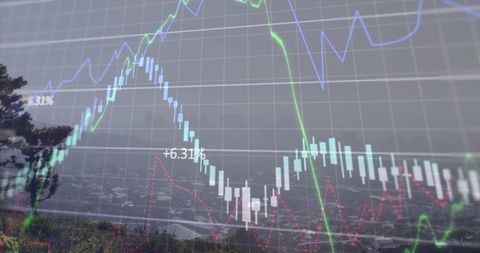
Abstract visualization of financial data and market trends on a sleek blue background. Featuring graphs and statistics, ideal for illustrating concepts of global business growth, financial analysis, stock market monitoring, and data-driven strategy. Perfect for use in corporate presentations, financial services marketing, technology hubs, and educational materials focused on finance and computing.

Powered by Adobe logo
Businessman analyzing financial data on futuristic digital screen with graphs and charts on a dark background, showcasing the finance growth concept. - Powered by AdobeTransparent or png stock market investment trading graph growth.Trade business analytics graph and financial chart.	
 - Powered by AdobeAbstract financial stock market graph with candlestick bars isolated on transparent background - Powered by Adobe
Dynamic blue and green digital stock market graph with bar charts and lines on a dark background, representing financial data analysis, investment trends, business growth, and global economy fluctuat - Powered by AdobeAn analyst uses a computer and dashboard for data business analysis and Data Management System with KPI and metrics connected to the database for technology finance, operations, sales, marketing  - Powered by Adobe

Credit Photo

If you would like to credit the Photo, here are some ways you can do so

Free (free of charge)

Free for personal and commercial use.

Author: Creative Art

Similar Free Stock Images

Dynamic Financial Data Trends with Blue Overlay
Premium
Financial data graph with rising and falling trends in vibrant colors
Global Data Processing Over Interactive World Map
Global Financial Data and Graphs Over Digital Globe Interface
Financial Data Overlay on Urban and Natural Landscape
Financial Data Analytics Over Urban Skyline Concept
Premium
Stock market graph with blue technology background, financial trading analysis chart, investment growth data visualization, economic business concept
Rising Graph with Data and Analysis Objects on Blue Background
Financial Data Visualization on Digital Grid
Futuristic 6G Network with Digital Interface and Data Growth
Financial Data Visualization Against Glass Office Facade
Premium
Document, team and business women with chart for discussion, financial investment or data analysis. Paperwork, planning and workers in office with graph for stats, brainstorming or strategy with tech
Financial Data and Graphs on Digital Blue Background
Digital Data Process and Analysis on Blue Background
Abstract City Traffic Analytics with Data Overlay
Downward Trending Graph with Office Background
Premium
Business Financing Accounting Banking Concept, Businesswoman doing finances and calculating financial report with business graph growth cahrt, finance and investment concept
Financial Data on Virtual Screen with Urban Background
Dynamic Data Visualization with Graphs over Blue Background
Statistical Graphs Over Cityscape Highlighting Business Growth
Abstract Financial Graphs with Trend Analysis Data in Blue Pink Hues
Premium
Hispanic Female Senior Data Scientist Reviewing Reports Of Risk Management Department On Big Digital Screen In Monitoring Room. Diverse Consulting Company Employees Working Behind Desktop Computers.
Dynamic Stock Market Data and Cityscape Background
Dynamic Stock Market Graph with Percentage Indicators
Global Financial Data Analysis on Grid Background
Colorful Digital Bar Graph Data Analysis Concept
Premium
Businesswoman Managing Company Data Using Analytics Dashboard
Red Line Graph Overlaying Office Computers Symbolizing Data Analysis
Digital Finance Dashboard with Rising Graph and Percentages
Economic Decline Illustrated with Chart and Red Arrow
Digital Financial Analytics Dashboard with Trend Indicators
Financial Analytics with Rising Graphs and Urban Skyline
Abstract Digital Interface Analyzing Global Financial Data
Premium
Two professional analyzing financial data graphs, charts on laptop display at a modern workspace. Financial analysis or business evaluation concept
Global Financial Data Interface with Rotating Globe Overlay
Digital Data Processing Overlay on Night Cityscape
Dynamic Financial Data Graph Overlaying Urban Skyline
Financial Growth Digital Graph with Stats Overlay
Premium
Magnifying glass is on a black background with a red and blue line
Financial Data Analysis on Blue Global Network
Rising Financial Graphs with Digital Data Interface
Financial Data Overlay on Glass Office Building
Financial Data Over Electric Sky Concept for Energy Sector
Premium
Business audit stock financial finance management on analysis data strategy with graph accounting marketing or report chart economy investment research profit concept
City Skyline Merging with Financial Graphs Demonstrating Market Trends
Digital Holographic Business Growth Charts
Stock Market Trends and Data Analysis over Digital Grid
Rising Data Trends on Gradient Graph with Business Insights
Premium
Futuristic financial data visualization with glowing blue line graphs and vertical bar chart, Abstract financial chart with rising graphs
Digital Data Processing Overlay on Cityscape at Dusk
Innovative Digital Data Chart Overlaid on Glass Building
Dynamic Stock Market Graphs Against Cloudy Sky Background
Stock Market Graph Reflecting Financial Trends and Analysis
Premium
Analyst working in Business Analytics and Data Management System to make report with KPI and metrics connected to database. Corporate strategy for finance, operations, sales, marketing.
Financial Data Processing with Analytics Overlay
Data Processing Visualization with Digital Charts on Blue Background
Dynamic Data Visualization with Urban Background
Global Financial Data and Stock Market Visualization
Premium
Digital forex and stock market chart with upward arrows and glowing data on dark screen background showing financial growth trends. 3D Rendering
Vibrant Financial Display with Trend Lines and Candlestick Chart
Financial Charts with Blue and Red Lines and Digital Percent Indicators
Abstract Financial Growth Chart with Rising Bars and Line Graphs
Financial Data Graphs Over Cityscape Indicating Global Business Concept
Cryptocurrency Market Data with Digital Charts and Graphs
Futuristic Data Analysis with Digital Charts and Code
Premium
Ai generated image of blue financial graph with upward trend isolated on transparent background
Financial Data overlay on Cityscape with Rising Graphs
Financial Data Overlay on Modern Cityscape Illustrating Market Trends
Abstract Graph Display with Dynamic Business Growth Indicators
Green Financial Data Line Graph Over Cityscape Background
Premium
Widescreen Abstract financial graph with uptrend line and bar chart of stock market on blue color background
Dynamic Financial Graph Analyzing Market Trends
Financial Data Analysis Graph with Growing Trends
Futuristic Data Analytics with Computer Circuitry
Global Shipping Data Analytics and Warehouse Visualization
Premium
Financial analysis concept featuring a magnifying glass over business charts demonstrating growth and increasing profits visualization.
Dynamic Financial Graphs with Illuminated Night Cityscene
Digital Financial Graphs Overlaying Cityscape
Financial Data Visualization with Cloudscape Background
Digital Financial Data with Illuminated Graph on Blue Interface
Premium
Abstract glowing big data forex candlestick chart on blurry city backdrop. Trade, technology, investment and analysis concept
Financial Data Visualization with Futuristic Bars and Lines
Financial Graph Analyzing Stock Market Trends
Financial Growth Chart Over Urban Cityscape, Business Data Concept
Futuristic Data Chart with Digital Interface Elements
Premium
Abstract representation of financial growth with glowing graphs and data patterns in dark background
Global Data Analytics with Interactive World Map and Diagrams
Financial Data Visualization with Dynamic Graphical Analysis
Financial Graph Illustrating Stock Market Growth Over Cityscape
Dynamic Stock Market Chart with Shoe Icons Overlay
Premium
3D green bar graph rising sharply, showcasing financial growth and success, ideal for business or financial presentations
Rising Data Trends in Urban Landscape with Translucent Chart Overlay
Digital Dashboard with Data Analytics and Visualization
Futuristic Digital Cityscape with Data Overlay and Infographics
European Stock Market Data Analysis
Global Finance and Economy Interface with Digital Graphs
Global Financial Data Overlay with High-Tech Cityscape
Premium
Magnifying glass focusing on candlestick chart, showcasing market analysis on a dark background, concept for financial review, investment strategy and business intelligence data analysis
Digital Financial Graphs and Binary Code on Blue Background
Statistical Data on Orange Gradient Background
Financial Growth Trends Over Urban Progress
Global Finance and Technology Concept with Dynamic Charts
Premium
Green arrow pointing upward on financial graph. Business growth chart with rising trend line. Digital stock market data visualization for investment analysis
6G Revolution with Globe and Financial Data Symbology
Stock Market Data Analysis with Digital Security Element
Growth Charts and Data Analysis Visual Illustration
Abstract Digital Data Technology and Analytics Visualization
Premium
Growth chart business strategy up arrow graph finance stock market or increase money profit diagram on financial concept success economy investment background with digital .
Digital Binary Code Finance Concept with Graphs
Global Financial Data Processing on Abstract World Map
Digital Visualization Financial Data Growth Progressive Graph
Financial Data Visualization with Growing Business Charts
Premium
Transparent or png stock market investment trading graph growth.Trade business analytics graph and financial chart.
Financial Data Analysis with Graphical Digital Interface
Analyzing Statistical Data Over Digital Network With Cityscape
Futuristic Business Technology Interface with Graphs and Icons
Abstract Financial Data Over Cityscape Imagery
Premium
Using tablet pc, Consultant between bookkeepers and accounting lawyer consultation about asset, balance sheet, stock market statistics and yearly tax law, protect business from bribery.
Futuristic Financial Data Analytics on Dark Background
Complex Financial Data Visuals with Coding Elements and Charts
Financial Market Love: Red Hearts and Economic Graph Integration
Digital Finance Dashboard with Market Trend Analytics in Office
Premium
Green graph line rising on bar chart. Stock market price growth, financial profit success in investment business.
Global Financial Market Analytics Dashboard Showing Bar Charts and Trend Lines