
- Home >
- Stock Photos >
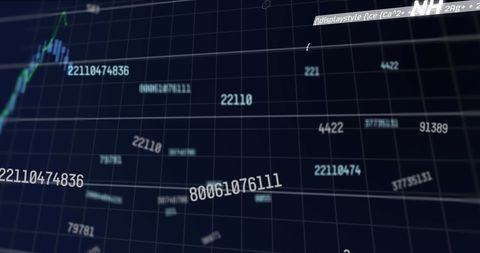
- Financial Data with Chemical Structures Displayed on Graph
Financial Data with Chemical Structures Displayed on Graph Image

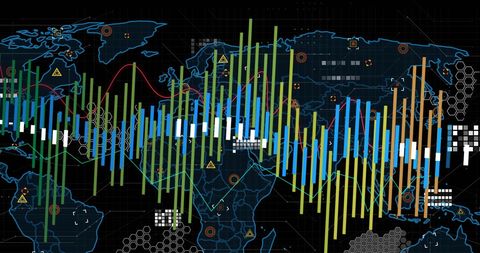
Abstract representation of financial data processing combined with chemical structures overlay. Illustrates intersection of finance and science fields enhanced by digital technology. Useful for financial technology, data analysis, scientific innovation themes.
Powered by  - Get 15% off with code: PIKWIZARD15


downloads
Tags:
More
Credit Photo
If you would like to credit the Photo, here are some ways you can do so
Text Link
photo Link
<span class="text-link">
<span>
<a target="_blank" href=https://pikwizard.com/photo/financial-data-with-chemical-structures-displayed-on-graph/142249cb0aff682cf3bc4985d330d38d/>PikWizard</a>
</span>
</span>
<span class="image-link">
<span
style="margin: 0 0 20px 0; display: inline-block; vertical-align: middle; width: 100%;"
>
<a
target="_blank"
href="https://pikwizard.com/photo/financial-data-with-chemical-structures-displayed-on-graph/142249cb0aff682cf3bc4985d330d38d/"
style="text-decoration: none; font-size: 10px; margin: 0;"
>
<img src="https://pikwizard.com/pw/medium/142249cb0aff682cf3bc4985d330d38d.jpg" style="margin: 0; width: 100%;" alt="" />
<p style="font-size: 12px; margin: 0;">PikWizard</p>
</a>
</span>
</span>
Free (free of charge)
Free for personal and commercial use.
Author: Creative Art
Similar Free Stock Images

Premium

Premium

Premium


Premium


Premium


Premium


Premium

Premium

Premium


Premium

Premium

Premium

Premium

Premium


Premium


Premium

Premium

Premium


Premium


Premium


Premium

Premium


Premium


Premium

Premium


Explore More Free Stock Images