
- Home >
- Stock Photos >
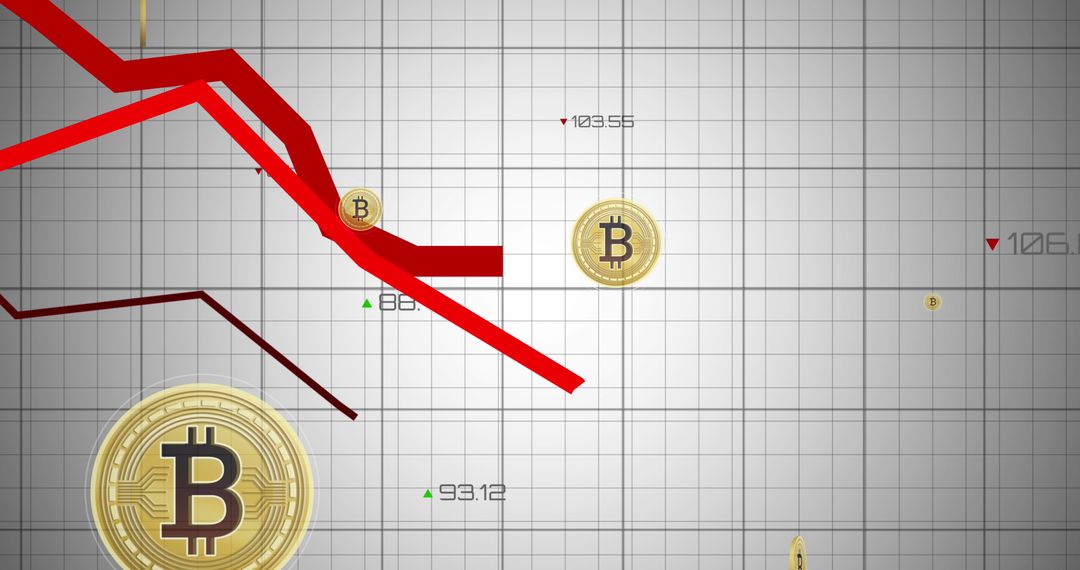
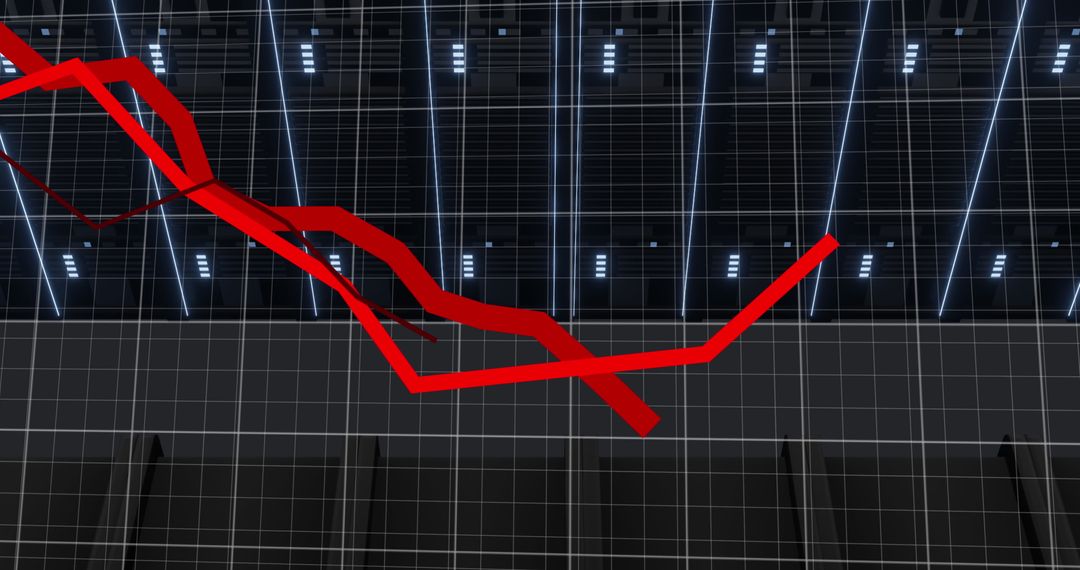
- Financial Data with Downward Trending Red Line Graph on Grid
Financial Data with Downward Trending Red Line Graph on Grid Image

Showcases financial and economic data visualized with a red line graph, suggesting negative trends. Ideal for illustrating concepts related to economic downturns, stock market crises, financial data analysis, business presentations, or reports on economic factors. Useful for blogs and articles discussing financial changes or market analytics.
Powered by  - Get 15% off with code: PIKWIZARD15


2
downloads
downloads
Tags:
More
Credit Photo
If you would like to credit the Photo, here are some ways you can do so
Text Link
photo Link
<span class="text-link">
<span>
<a target="_blank" href=https://pikwizard.com/photo/financial-data-with-downward-trending-red-line-graph-on-grid/20c52a2743a9f4689b3eff75f0ce934c/>PikWizard</a>
</span>
</span>
<span class="image-link">
<span
style="margin: 0 0 20px 0; display: inline-block; vertical-align: middle; width: 100%;"
>
<a
target="_blank"
href="https://pikwizard.com/photo/financial-data-with-downward-trending-red-line-graph-on-grid/20c52a2743a9f4689b3eff75f0ce934c/"
style="text-decoration: none; font-size: 10px; margin: 0;"
>
<img src="https://pikwizard.com/pw/medium/20c52a2743a9f4689b3eff75f0ce934c.jpg" style="margin: 0; width: 100%;" alt="" />
<p style="font-size: 12px; margin: 0;">PikWizard</p>
</a>
</span>
</span>
Free (free of charge)
Free for personal and commercial use.
Author: Awesome Content
Similar Free Stock Images

Premium


Premium


Premium


Premium


Premium


Premium


Premium


Premium


Premium


Premium


Premium


Premium


Premium


Premium


Premium


Premium


Premium


Premium


Premium


Premium


Premium


Premium


Premium


Premium

