- Home >
- Stock Photos >
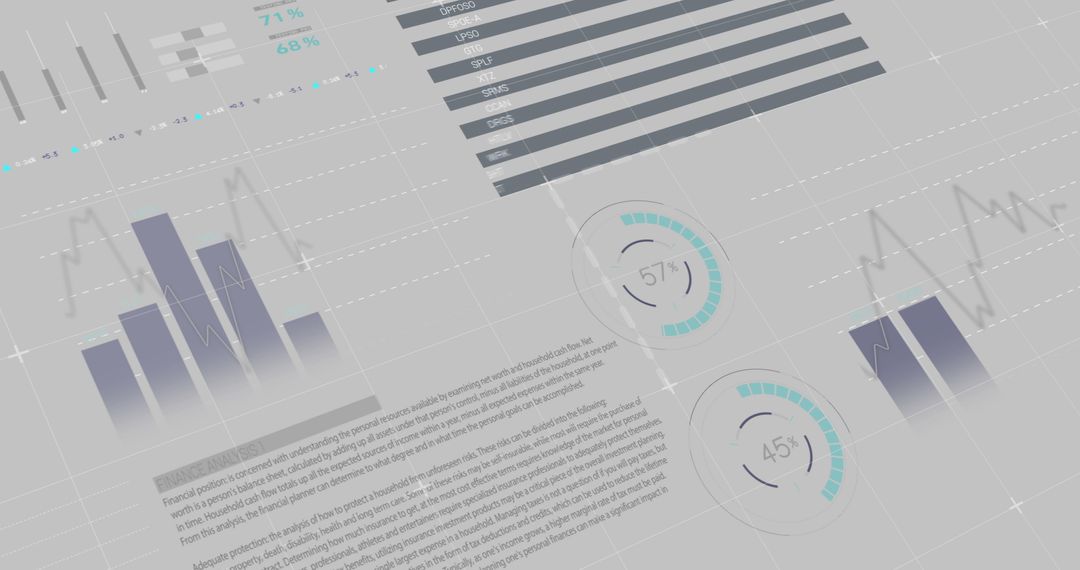
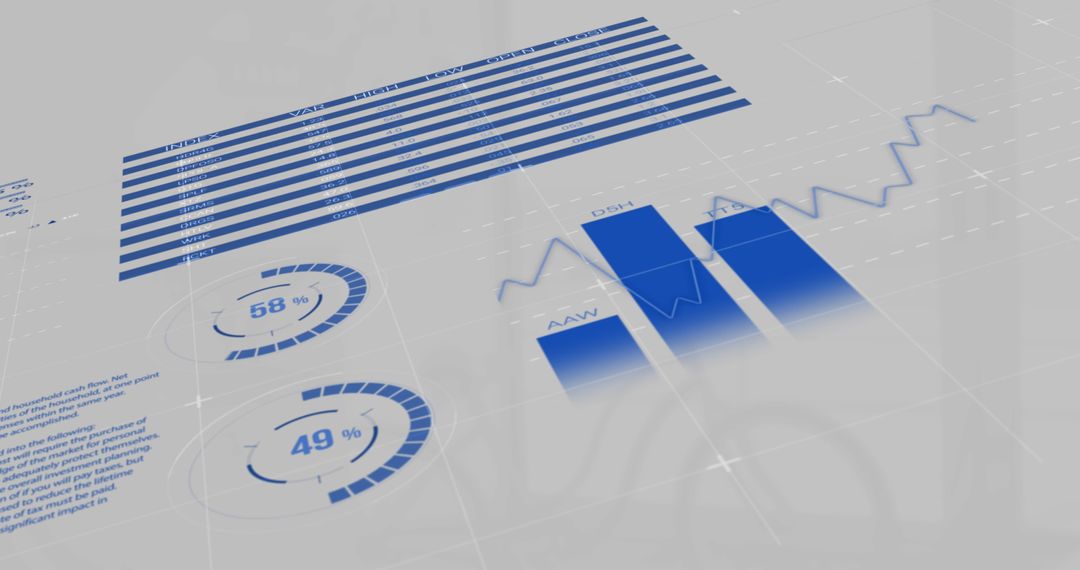
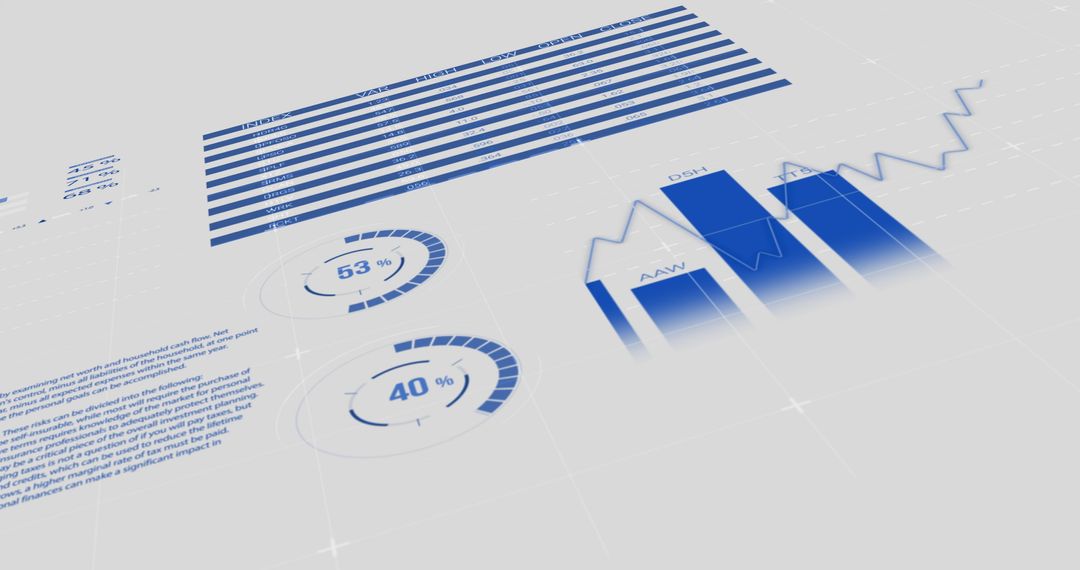
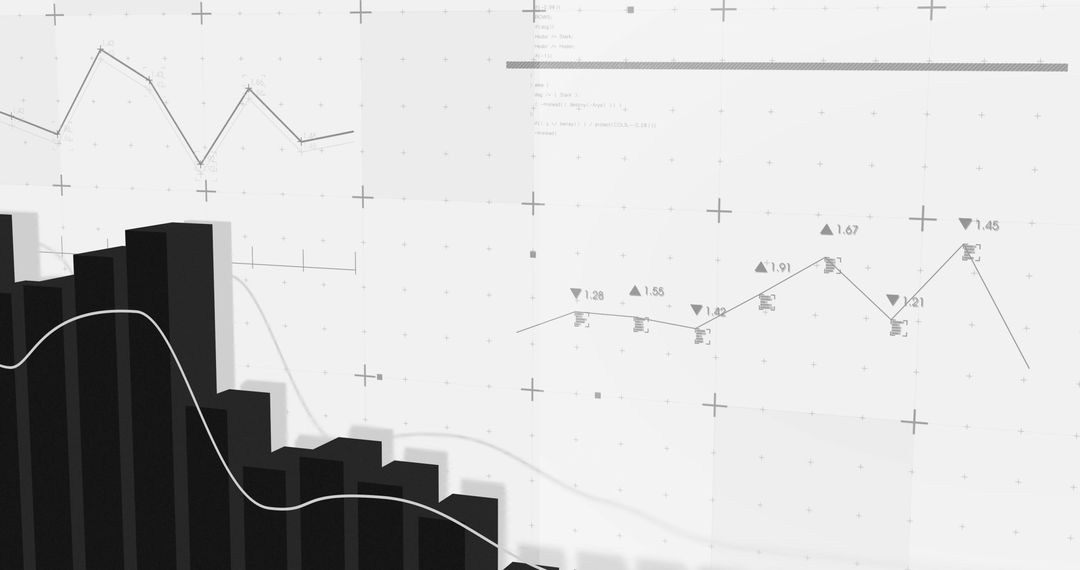
- Financial Data with Graphs over Abstract Steps
Financial Data with Graphs over Abstract Steps Image

This image showcases abstract steps overlaid with financial data and graphs, representing growth and progress in business and economics. Suitable for use in business reports, presentations on economic data analysis, and marketing materials for financial institutions highlighting data processing capabilities.
Powered by 


2
downloads
downloads
Tags:
More
Credit Photo
If you would like to credit the Photo, here are some ways you can do so
Text Link
photo Link
<span class="text-link">
<span>
<a target="_blank" href=https://pikwizard.com/photo/financial-data-with-graphs-over-abstract-steps/7064777be055c674ad5289c9e9150cdc/>PikWizard</a>
</span>
</span>
<span class="image-link">
<span
style="margin: 0 0 20px 0; display: inline-block; vertical-align: middle; width: 100%;"
>
<a
target="_blank"
href="https://pikwizard.com/photo/financial-data-with-graphs-over-abstract-steps/7064777be055c674ad5289c9e9150cdc/"
style="text-decoration: none; font-size: 10px; margin: 0;"
>
<img src="https://pikwizard.com/pw/medium/7064777be055c674ad5289c9e9150cdc.jpg" style="margin: 0; width: 100%;" alt="" />
<p style="font-size: 12px; margin: 0;">PikWizard</p>
</a>
</span>
</span>
Free (free of charge)
Free for personal and commercial use.
Author: Creative Art
Similar Free Stock Images

Premium


Premium


Premium


Premium


Premium


Premium


Premium


Premium


Premium


Premium


Premium


Premium


Premium


Premium


Premium


Premium


Premium


Premium


Premium


Premium


Premium


Premium


Premium


Premium