- Home >
- Stock Photos >
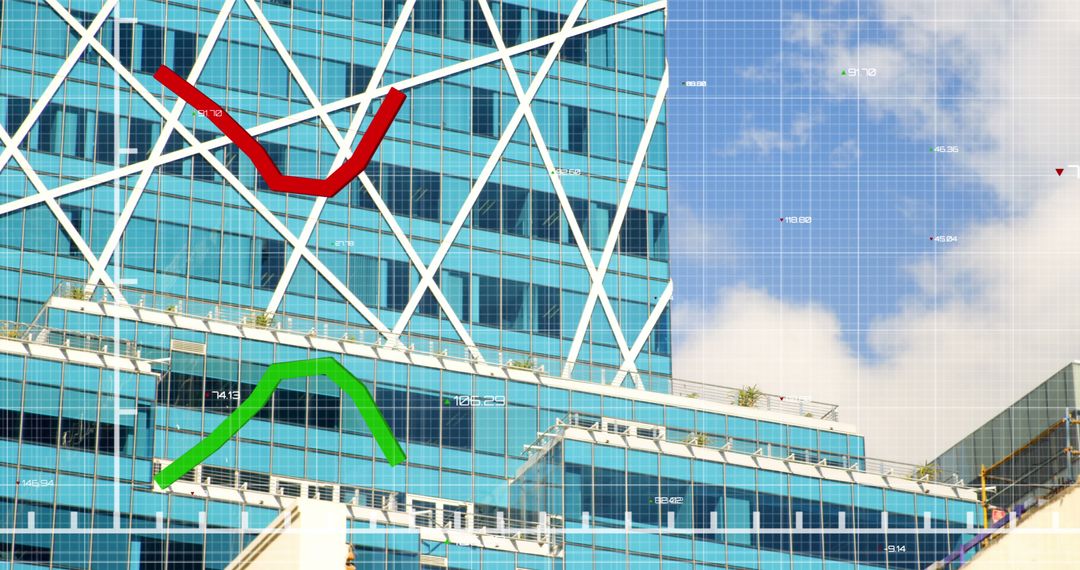
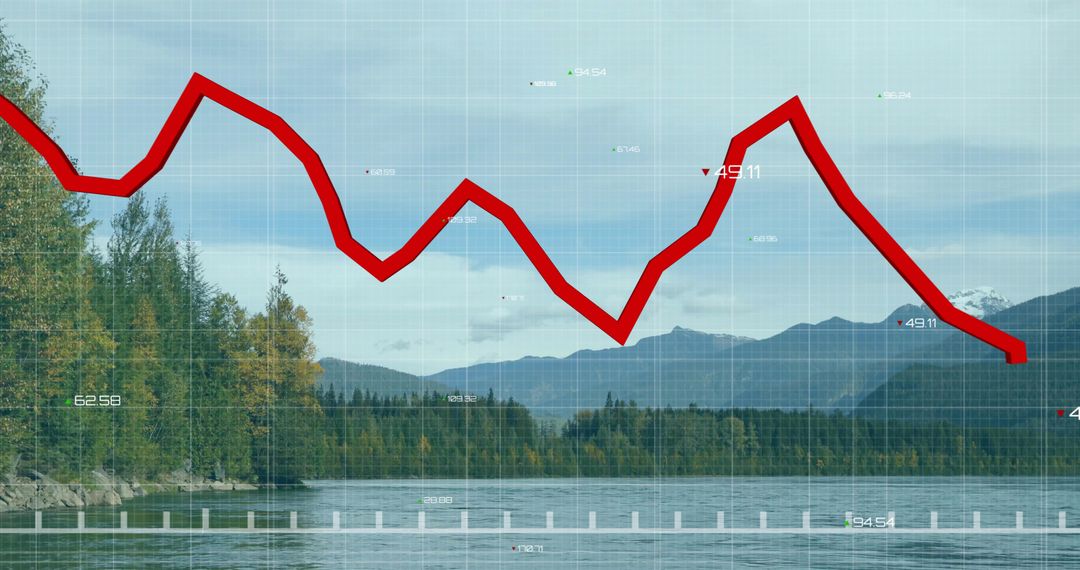
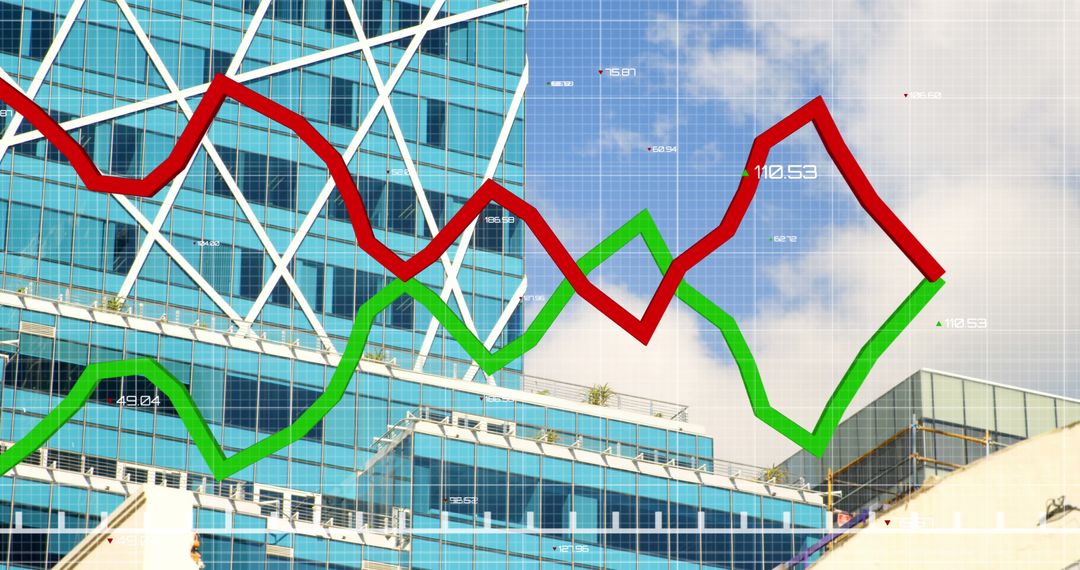
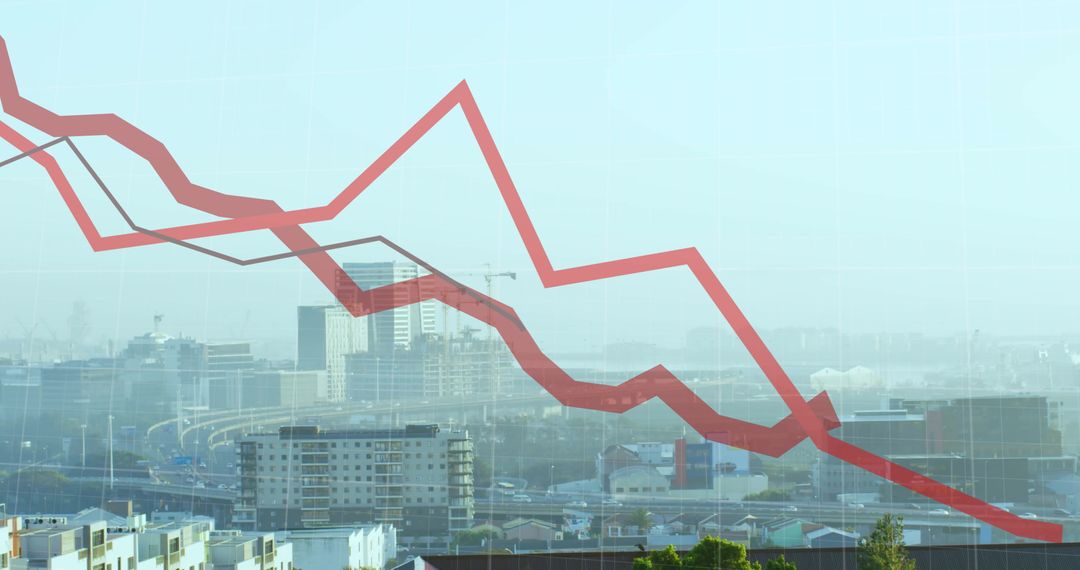
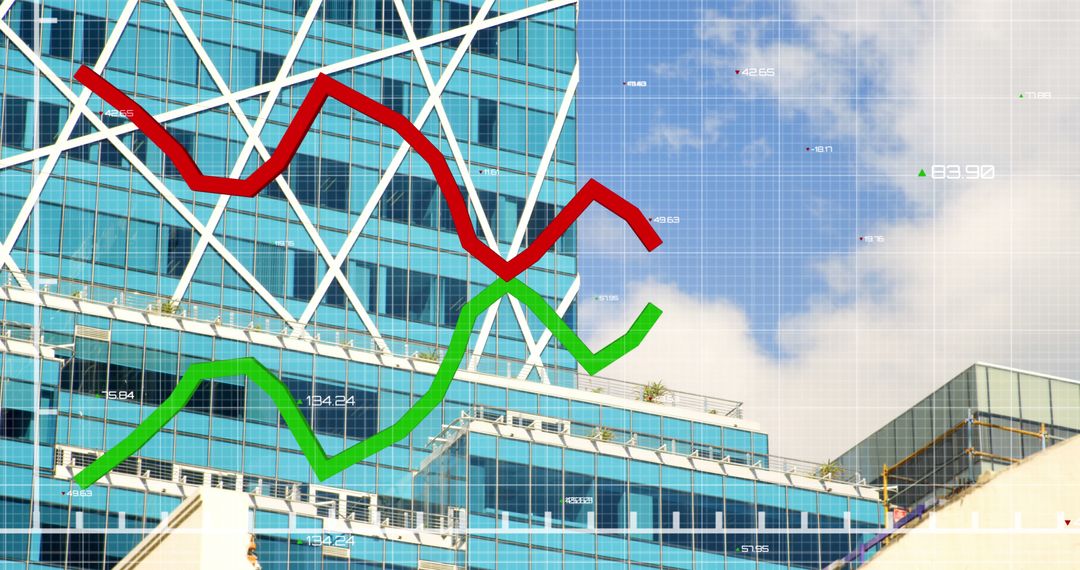
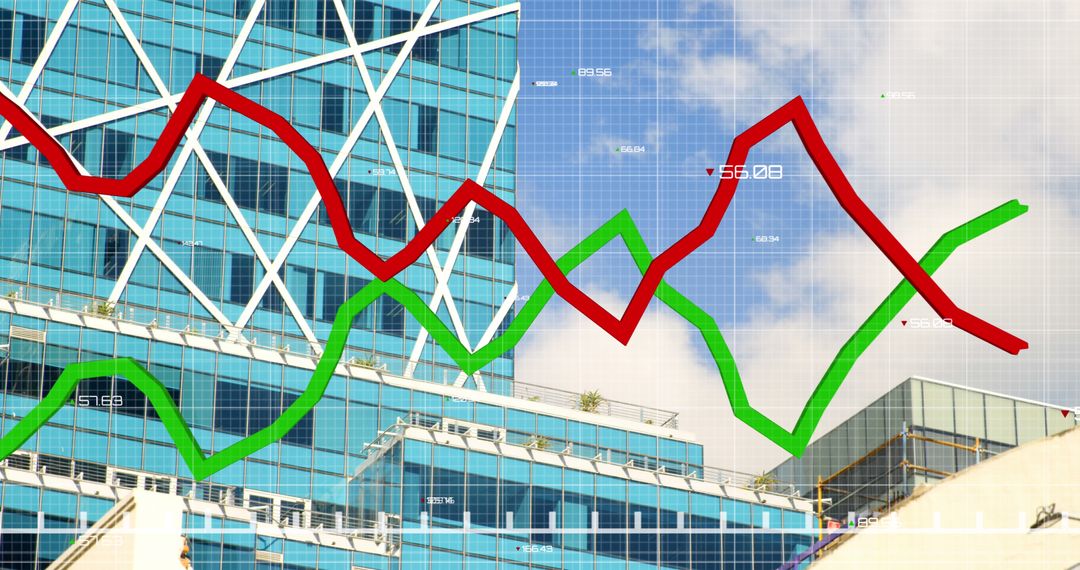
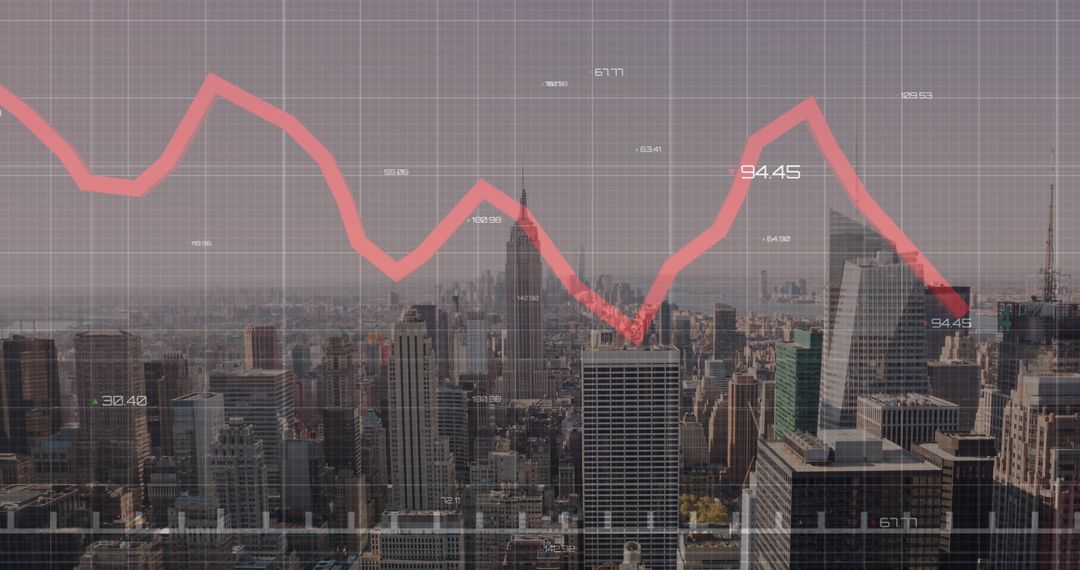
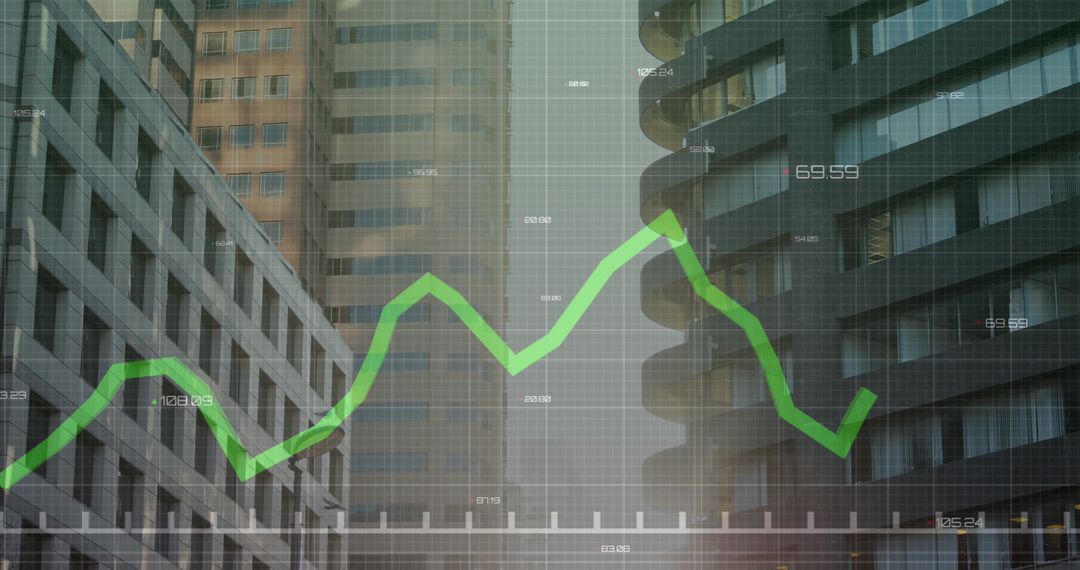
- Financial Data with Market Trends and Modern Architecture
Financial Data with Market Trends and Modern Architecture Image
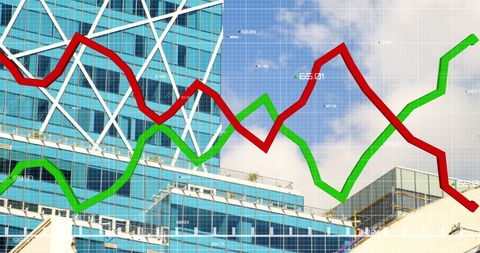
Financial data shown with red and green trend lines overlaid on image of modern building, illustrating global business and housing market fluctuations. Ideal for articles on real estate markets, investment strategies, or economic analysis visualizations.
Powered by 


4
downloads
downloads
Tags:
More
Credit Photo
If you would like to credit the Photo, here are some ways you can do so
Text Link
photo Link
<span class="text-link">
<span>
<a target="_blank" href=https://pikwizard.com/photo/financial-data-with-market-trends-and-modern-architecture/f25568a071aaed321d22c95563225bbb/>PikWizard</a>
</span>
</span>
<span class="image-link">
<span
style="margin: 0 0 20px 0; display: inline-block; vertical-align: middle; width: 100%;"
>
<a
target="_blank"
href="https://pikwizard.com/photo/financial-data-with-market-trends-and-modern-architecture/f25568a071aaed321d22c95563225bbb/"
style="text-decoration: none; font-size: 10px; margin: 0;"
>
<img src="https://pikwizard.com/pw/medium/f25568a071aaed321d22c95563225bbb.jpg" style="margin: 0; width: 100%;" alt="" />
<p style="font-size: 12px; margin: 0;">PikWizard</p>
</a>
</span>
</span>
Free (free of charge)
Free for personal and commercial use.
Author: People Creations
Similar Free Stock Images

Premium


Premium


Premium


Premium


Premium


Premium


Premium


Premium


Premium


Premium


Premium


Premium


Premium


Premium


Premium


Premium


Premium


Premium


Premium


Premium


Premium


Premium


Premium


Premium