- Home >
- Stock Photos >
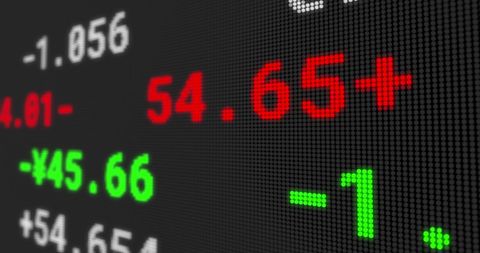
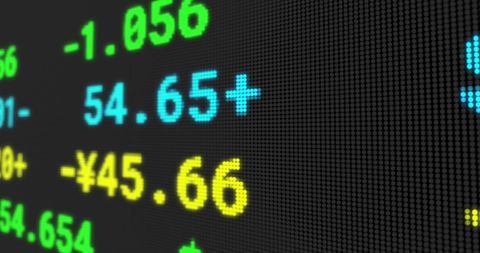
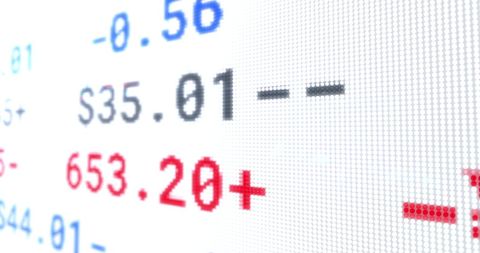
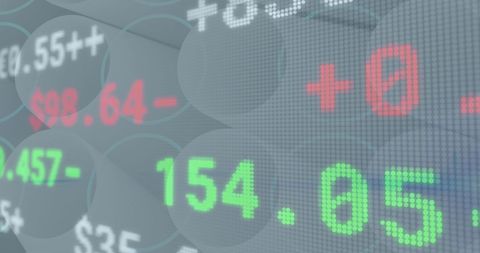
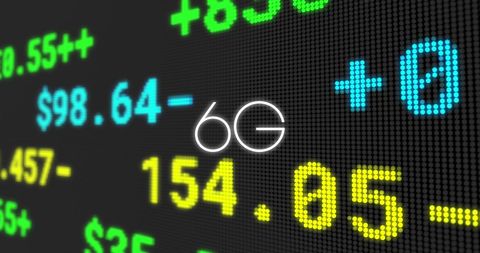
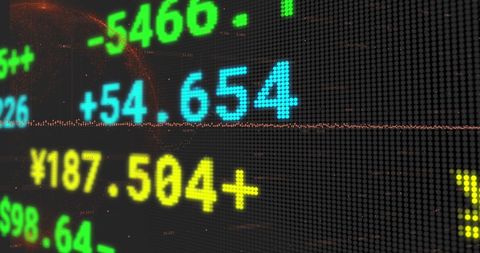
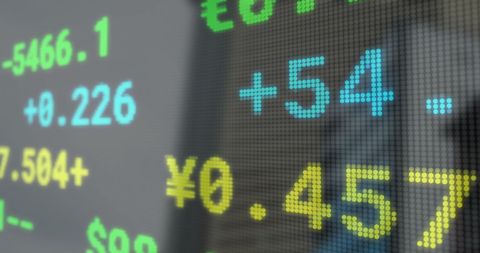
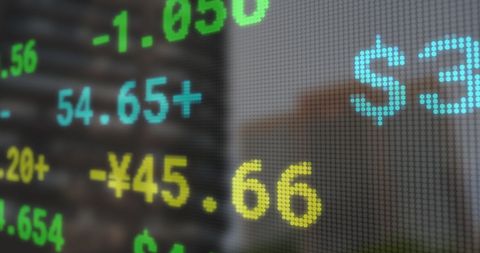
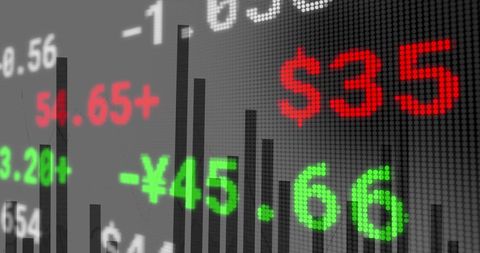
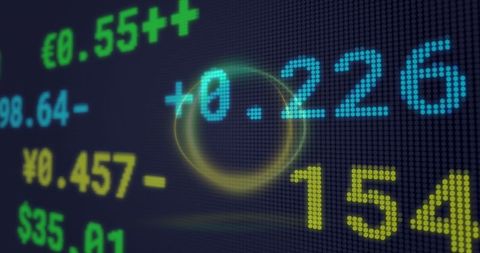
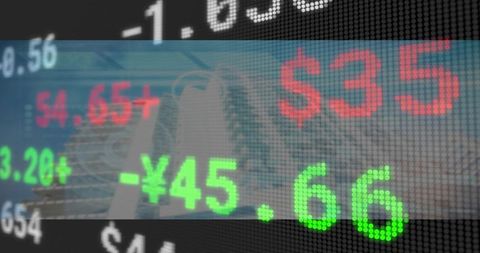
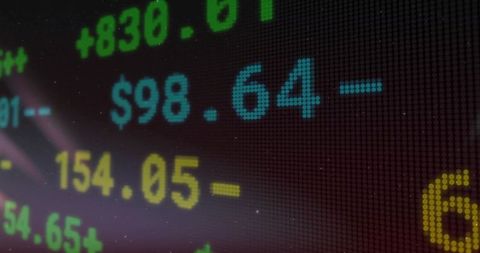
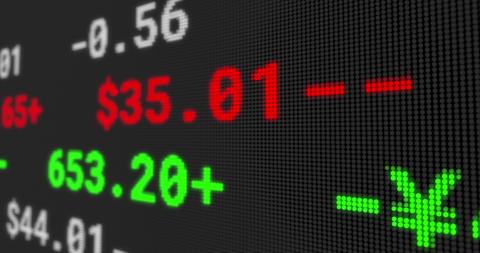
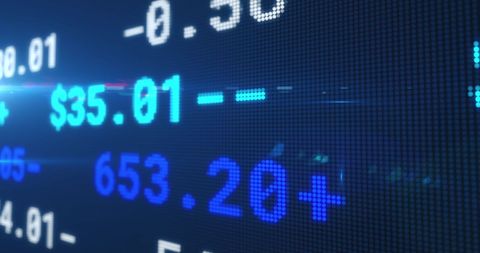
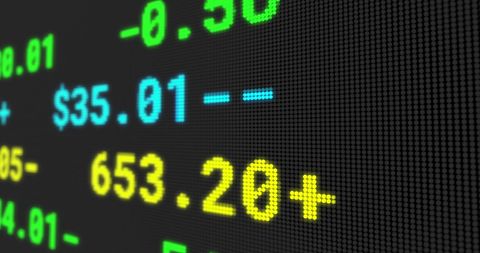
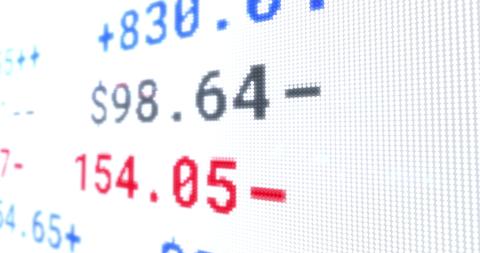
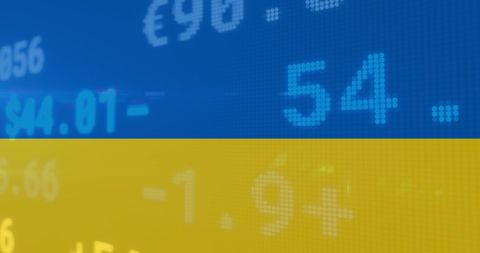
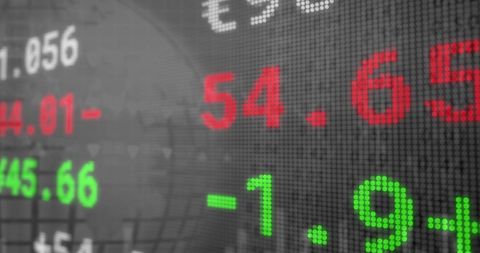
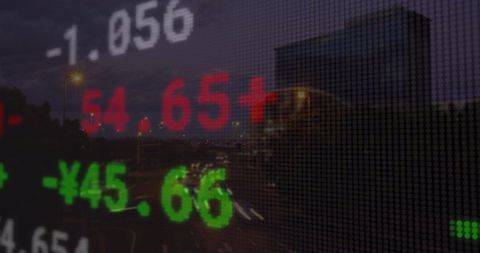
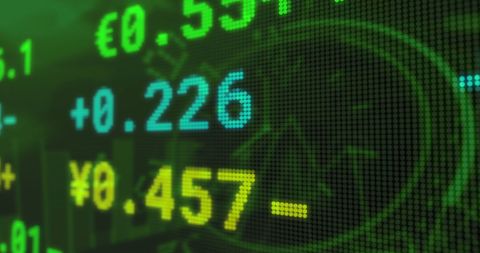
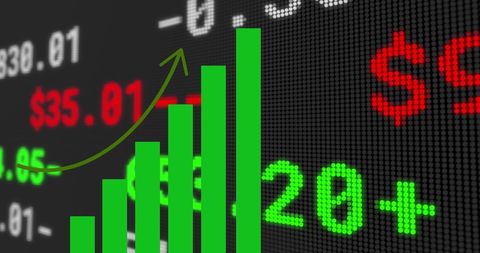
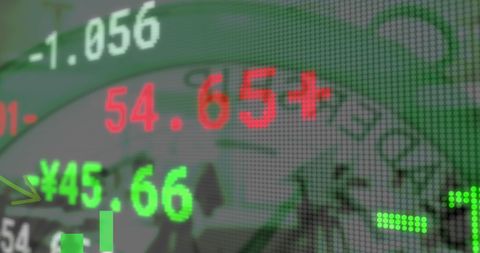
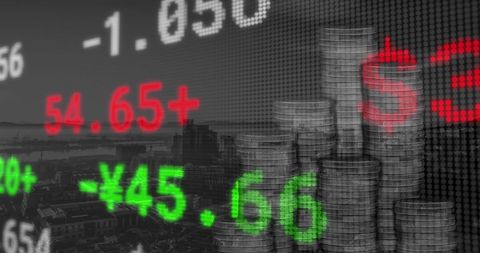
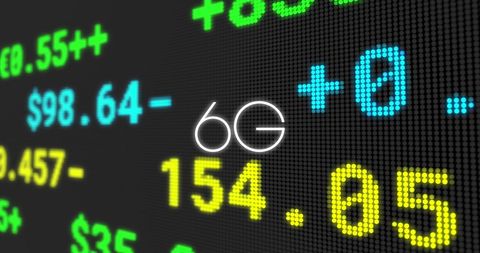
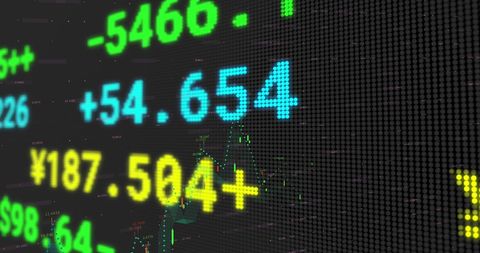
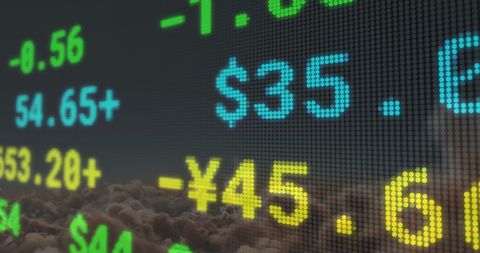
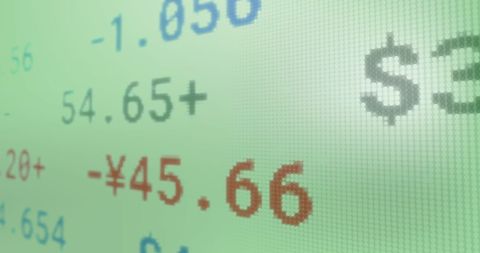
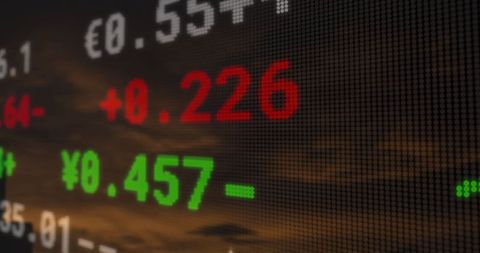
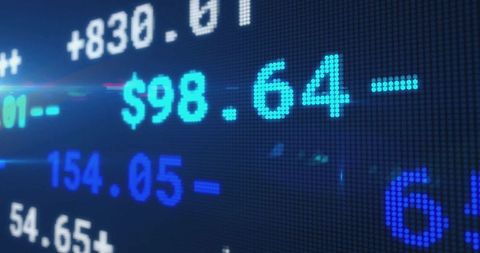
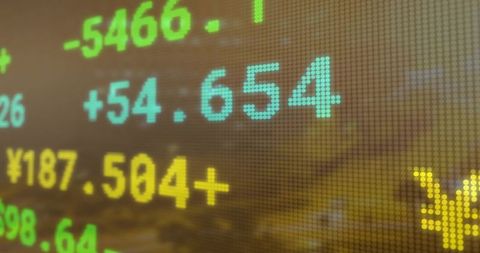
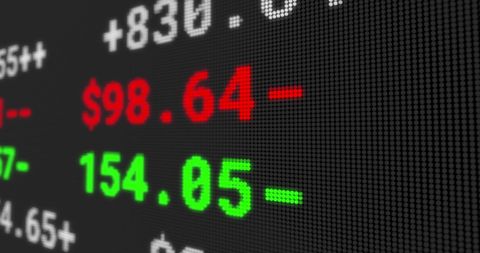
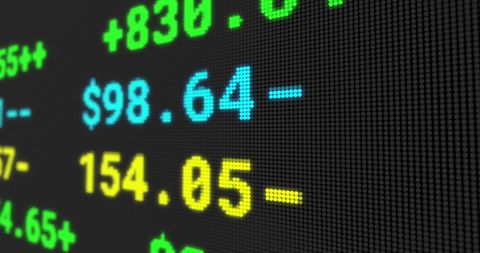
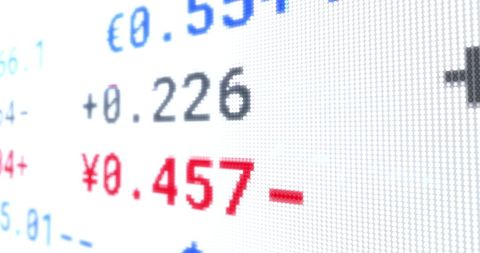
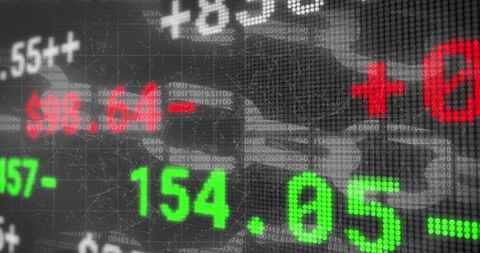
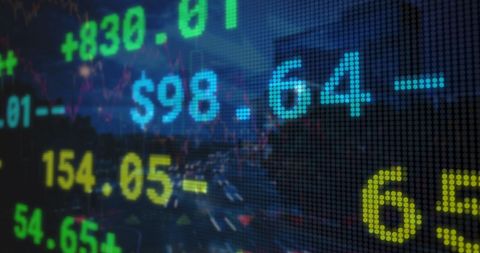
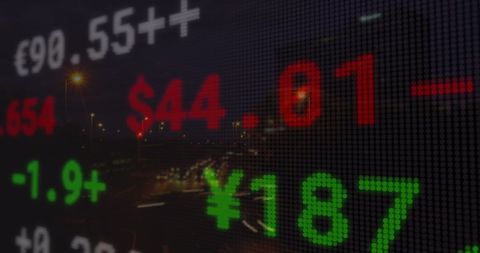
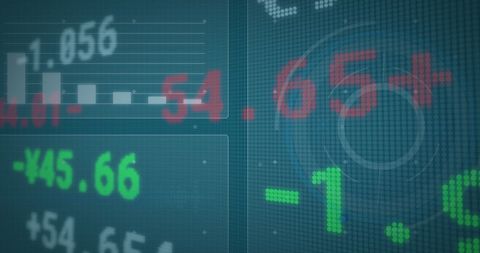
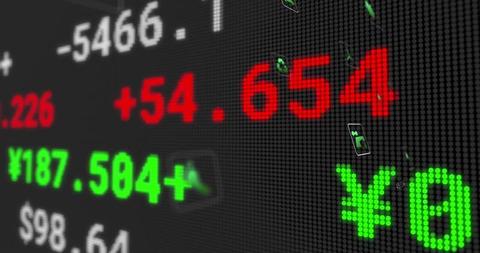
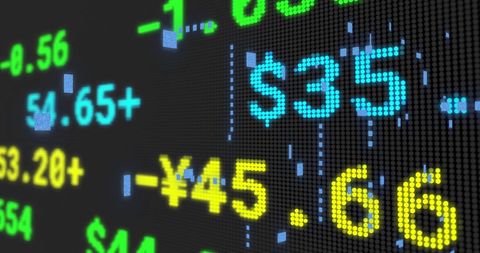
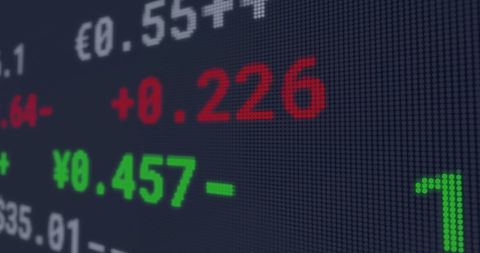
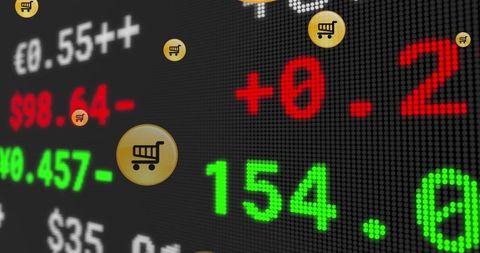
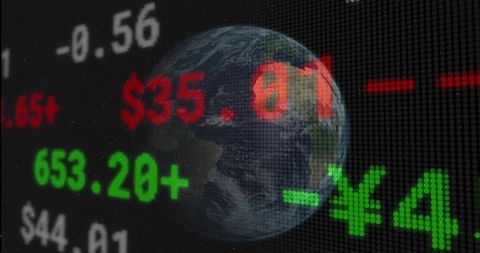
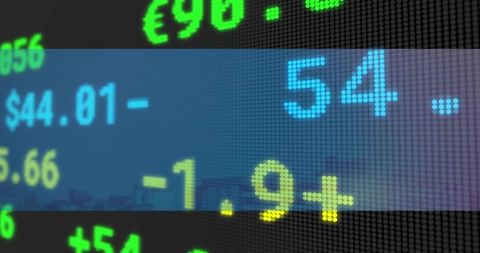
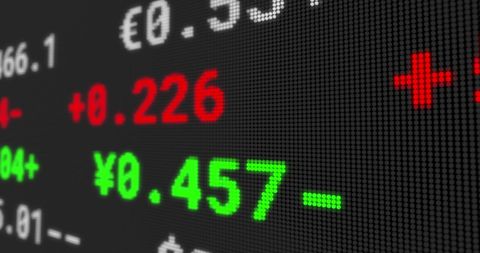
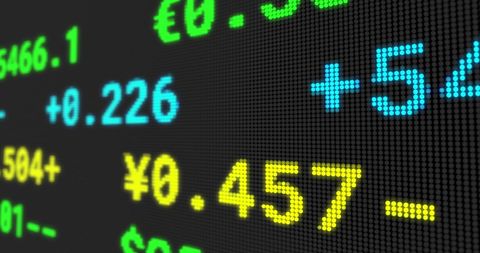
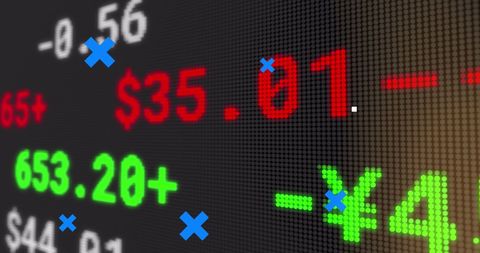
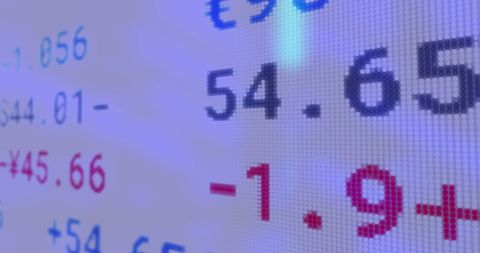
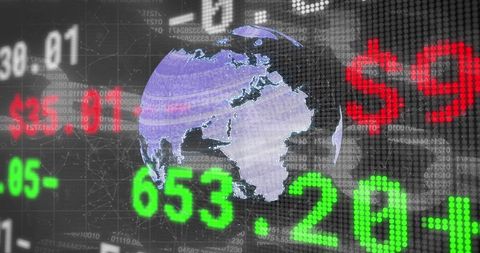
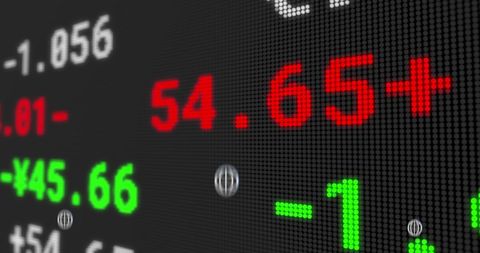
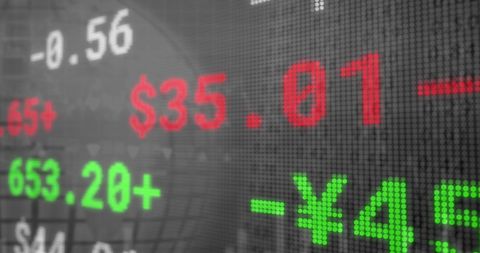
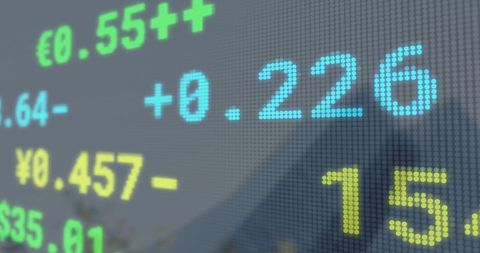
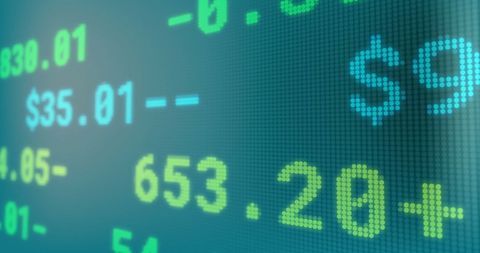
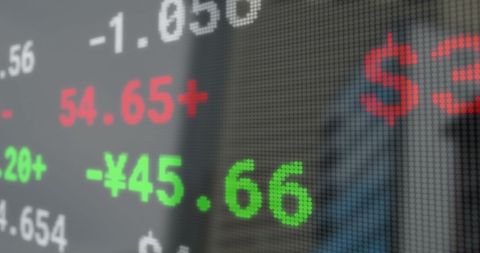
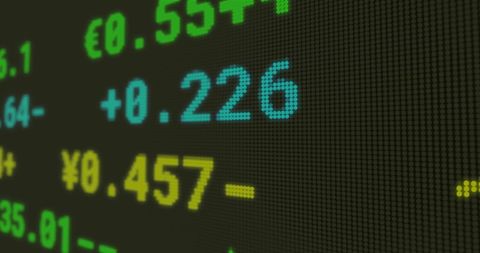
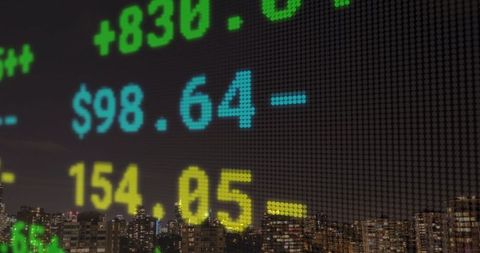
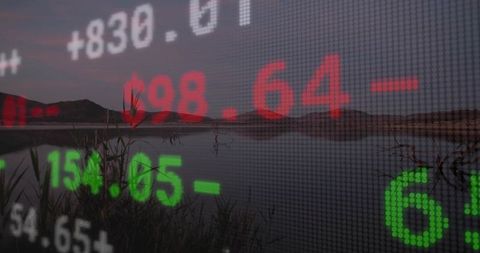
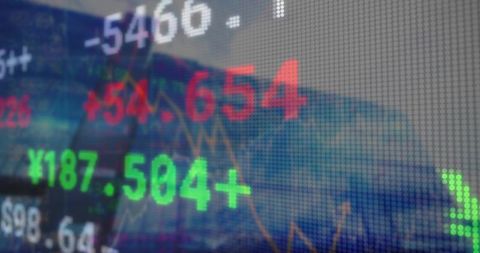
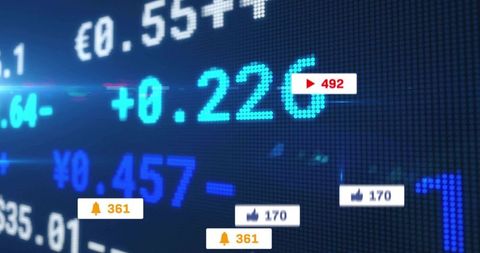
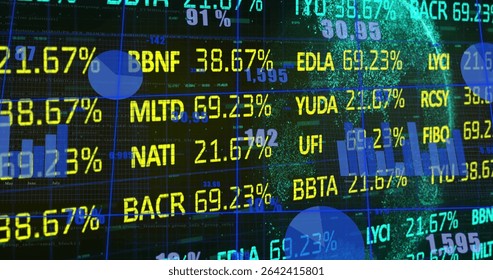
- Financial Data with Pixelated Tickers and World Map
Financial Data with Pixelated Tickers and World Map Image
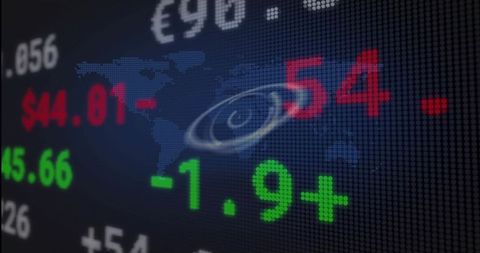
Screen showing live financial data with pixelated tickers and a world map silhouette. Red and green numbers represent stock changes, ideal for illustrating concepts in finance, global economy, and digital trading. Perfect for use in reports, financial blogs, and presentations to show market dynamics and investment trends peacefully; adds high-tech aesthetics.
Powered by  - Get 15% off with code: PIKWIZARD15


0
downloads
downloads
Tags:
More
Credit Photo
If you would like to credit the Photo, here are some ways you can do so
Text Link
photo Link
<span class="text-link">
<span>
<a target="_blank" href=https://pikwizard.com/photo/financial-data-with-pixelated-tickers-and-world-map/1f5a136291c7974045aeb84beca77042/>PikWizard</a>
</span>
</span>
<span class="image-link">
<span
style="margin: 0 0 20px 0; display: inline-block; vertical-align: middle; width: 100%;"
>
<a
target="_blank"
href="https://pikwizard.com/photo/financial-data-with-pixelated-tickers-and-world-map/1f5a136291c7974045aeb84beca77042/"
style="text-decoration: none; font-size: 10px; margin: 0;"
>
<img src="https://pikwizard.com/pw/medium/1f5a136291c7974045aeb84beca77042.jpg" style="margin: 0; width: 100%;" alt="" />
<p style="font-size: 12px; margin: 0;">PikWizard</p>
</a>
</span>
</span>
Free (free of charge)
Free for personal and commercial use.
Author: Awesome Content